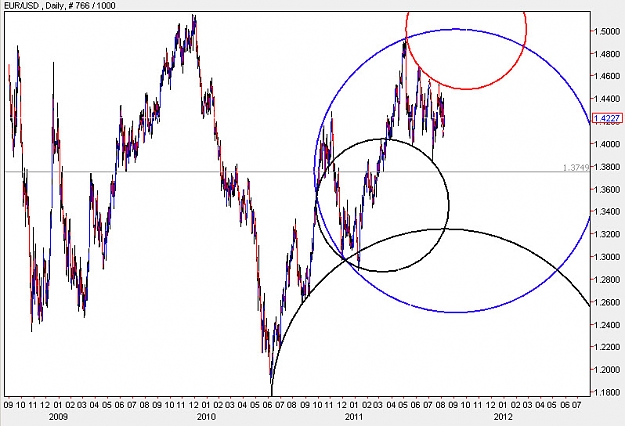
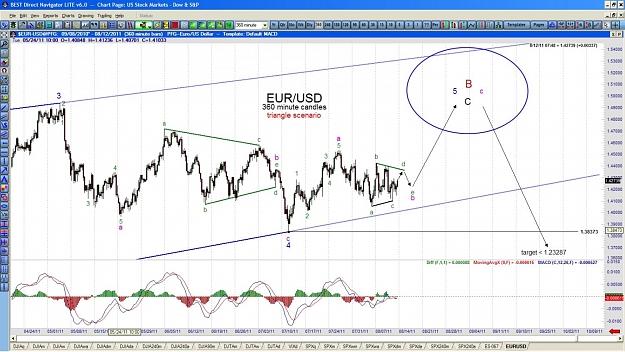
Daily
The blue circle is a important resistance/support level, and the red circle has held its resistance spot along its outer edge very strongly. The last attempt of this pair to break through the red circle was at 4527 which failed as well. The center of the blue circle is where movement is targeting and is a area that once it gets approached and broken, then there is very little support between 3750/3850 and lower levels. The first strong support level is around 3200. This implies that the 38.2 fibonacci retracement of the move from 1800 to 4900 which falls at 3850 is a very important level that will put EUR on a full bearish mode till a minimum of 3000/3200 region. In the worst case scenario if the center of the blue circle is breached, then we could also have the possibility of a perimeter to perimeter move to the 2600 level too.
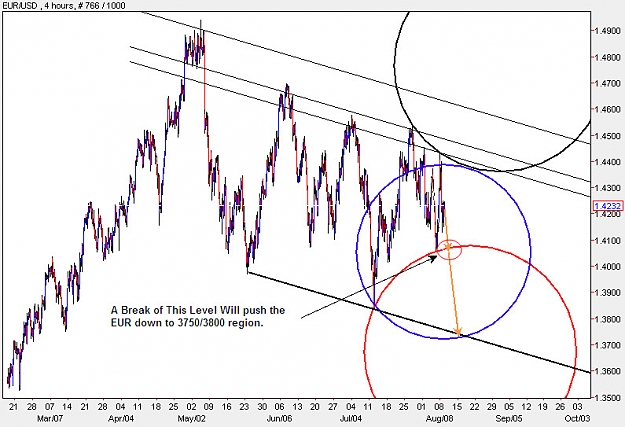
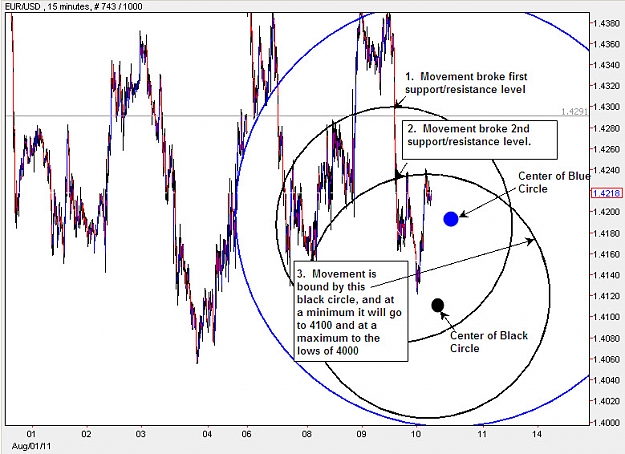
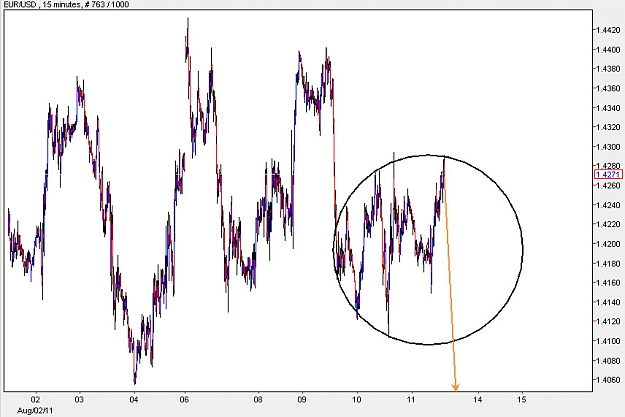
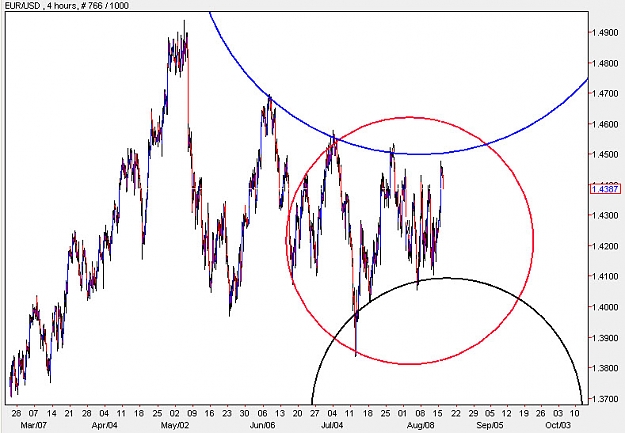
H4
The opposite perimeter region of the blue circle,and the center of the red circle along with the solid black straight trendline intersect relatively in the same region, which is 3750/3800 region. This will be the destination of the EUR on this time frame, once 4050 gets broken.
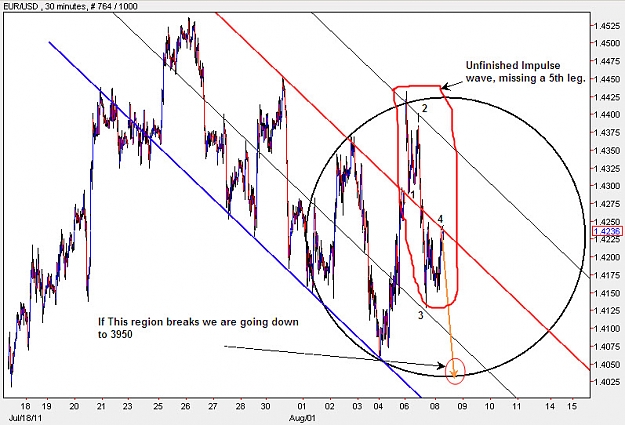
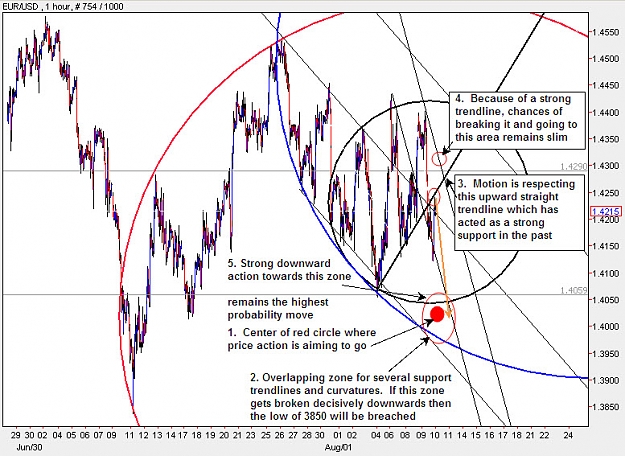
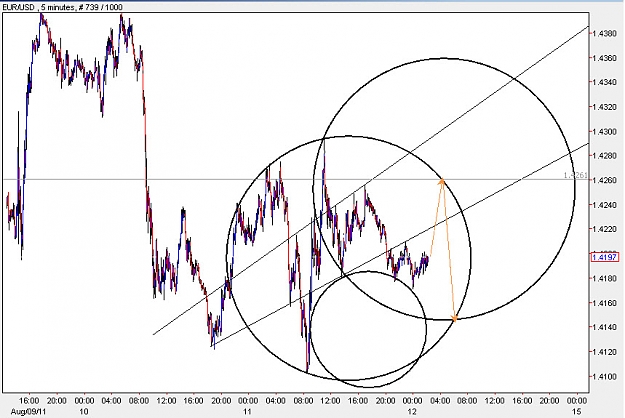
H1
The perimeter of the black circle has been used for support and resistance. Movement has showed a slight reaction at the center of the black circle, as it dropped from 4433, but its also at a strong trendline (red one) which it would find it difficult to penetrate decisively in the upward direction. This circle is the most important circle on all time frames which is dictating unfinished motion that has to end up at the opposite perimeter of the circle around 4050. Chances are high that if the south pole of the black circle gets broken then the blue trendline will be reached. Thats around the 3950 region.
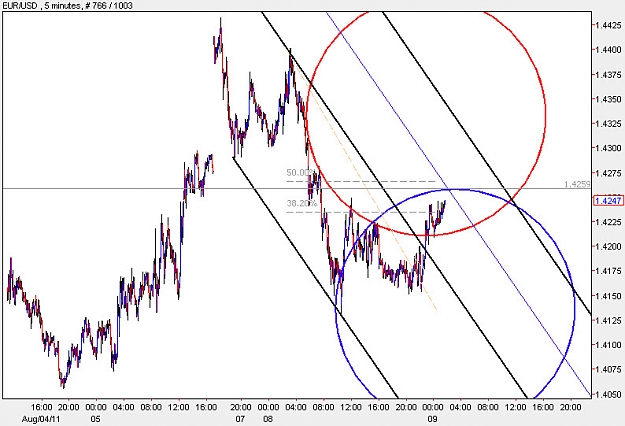
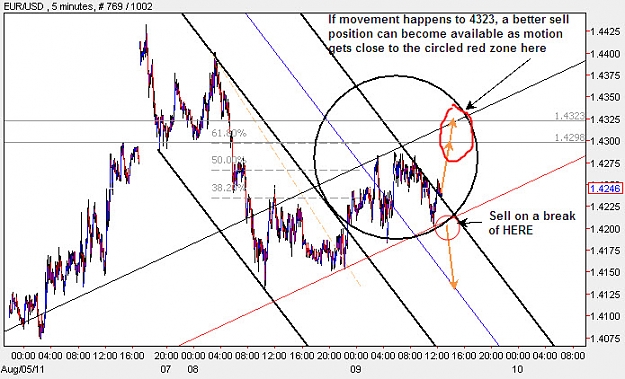
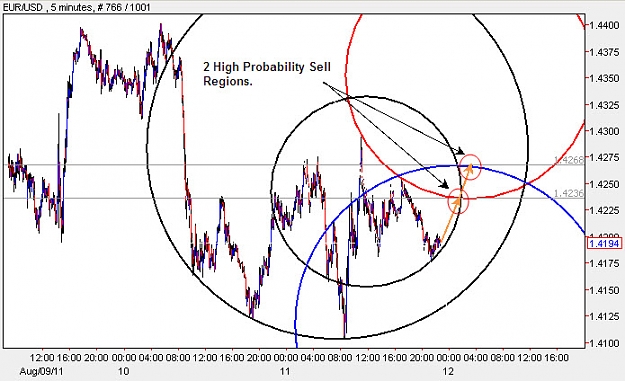
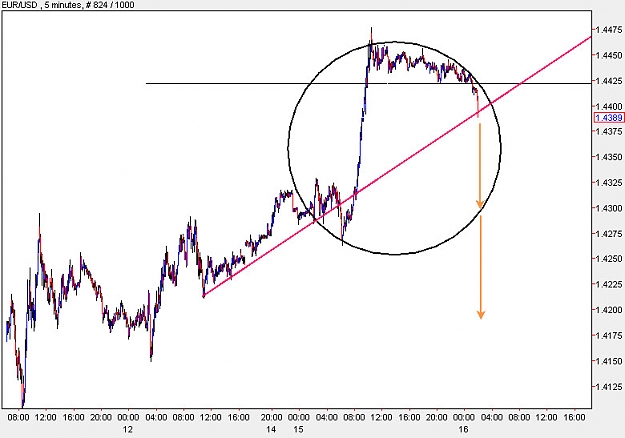
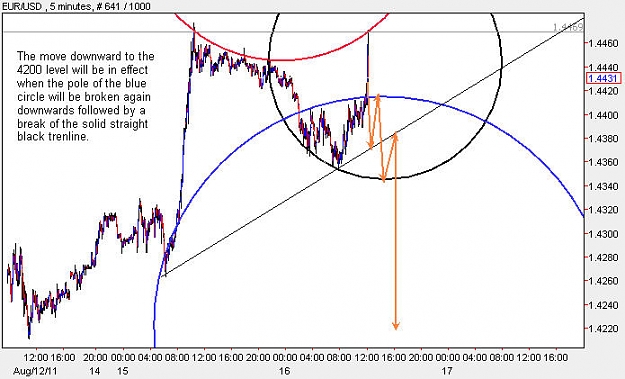
M5
We are right now at the 38.2 fibonacci retracement of the move from 4403-4130. We also have the pole of the red circle broken. This however could be a false break as long as the movement does not go beyond the pole of the blue circle. On the other hand the pole of the blue circle is also close to the blue straight trendline, which is acting as a median line as well. This is a double reinforcement for the resistance at 4260 zone, making it a harder zone to break.
If this area breaks upwards and the break is strong. it can be the grounds for further agitation 4300 and 4400 again. This will alter the shape of our M30 time frame and the analysis that went with it, and in such a event its best to wait before going short again or try a pending order at the lower end of the movement. On the other hand a dip below the red curve will set the stage for further lows to 4050
The blue circle is a important resistance/support level, and the red circle has held its resistance spot along its outer edge very strongly. The last attempt of this pair to break through the red circle was at 4527 which failed as well. The center of the blue circle is where movement is targeting and is a area that once it gets approached and broken, then there is very little support between 3750/3850 and lower levels. The first strong support level is around 3200. This implies that the 38.2 fibonacci retracement of the move from 1800 to 4900 which falls at 3850 is a very important level that will put EUR on a full bearish mode till a minimum of 3000/3200 region. In the worst case scenario if the center of the blue circle is breached, then we could also have the possibility of a perimeter to perimeter move to the 2600 level too.
H4
The opposite perimeter region of the blue circle,and the center of the red circle along with the solid black straight trendline intersect relatively in the same region, which is 3750/3800 region. This will be the destination of the EUR on this time frame, once 4050 gets broken.
H1
The perimeter of the black circle has been used for support and resistance. Movement has showed a slight reaction at the center of the black circle, as it dropped from 4433, but its also at a strong trendline (red one) which it would find it difficult to penetrate decisively in the upward direction. This circle is the most important circle on all time frames which is dictating unfinished motion that has to end up at the opposite perimeter of the circle around 4050. Chances are high that if the south pole of the black circle gets broken then the blue trendline will be reached. Thats around the 3950 region.
M5
We are right now at the 38.2 fibonacci retracement of the move from 4403-4130. We also have the pole of the red circle broken. This however could be a false break as long as the movement does not go beyond the pole of the blue circle. On the other hand the pole of the blue circle is also close to the blue straight trendline, which is acting as a median line as well. This is a double reinforcement for the resistance at 4260 zone, making it a harder zone to break.
If this area breaks upwards and the break is strong. it can be the grounds for further agitation 4300 and 4400 again. This will alter the shape of our M30 time frame and the analysis that went with it, and in such a event its best to wait before going short again or try a pending order at the lower end of the movement. On the other hand a dip below the red curve will set the stage for further lows to 4050
Attached Image(s) (click to enlarge)