Sorry, still not quite right, but it's getting closer
still problems on the mildly striking bands
you have two green boxes, one for MSCT and one for MSBT, but you have mixed and matched the criteria for uptrend / downtrend
should be
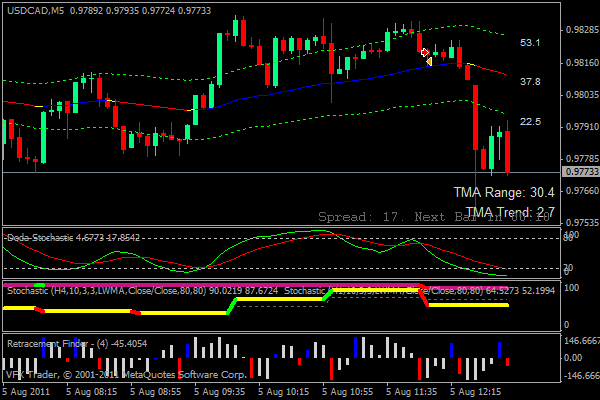
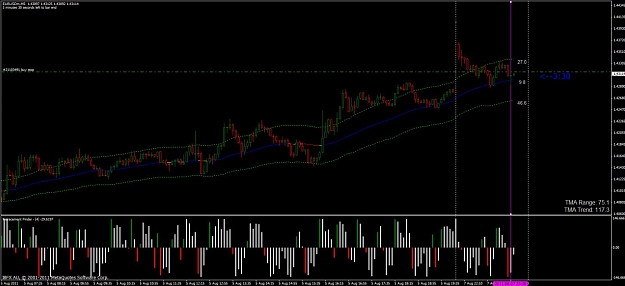
MSBT - Uptrend - bounces of lower TMA, Downtrend - bounces of Upper TMA
MSCT - Uptrend - bounces of upper TMA with a double top (SL less than 15), Downtrend - bounces of lower TMA with a double bottom (SL less than 15)
In addition, on the part where you put how to recognize the bands (with the alternating red/blue/yellow etc.) you might want to add the bit I recently mentioned that if most of the candles in the recent run were OUTSIDE of the bands, this indicates more likely than not striking
Regards, John
still problems on the mildly striking bands
you have two green boxes, one for MSCT and one for MSBT, but you have mixed and matched the criteria for uptrend / downtrend
should be
MSBT - Uptrend - bounces of lower TMA, Downtrend - bounces of Upper TMA
MSCT - Uptrend - bounces of upper TMA with a double top (SL less than 15), Downtrend - bounces of lower TMA with a double bottom (SL less than 15)
In addition, on the part where you put how to recognize the bands (with the alternating red/blue/yellow etc.) you might want to add the bit I recently mentioned that if most of the candles in the recent run were OUTSIDE of the bands, this indicates more likely than not striking
Regards, John
DislikedOK.......as promised here is the updated flow chart that I use as a reference for trade identification. Hopefully some will find it useful.Ignored