|
Additional Username
|
Joined May 2011
|1,866 Posts
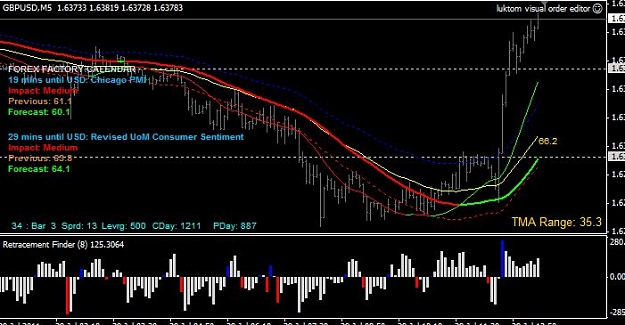
right now everything is out the door as the obvious Price rules.. your two sets of eyes as tool is the one and only to rely on.. lol
the bands the s/r's the round numbers whatever a hell else is irrelevant, meaningless.. market is spiking bullish like crazy and is unsettle till some time later if and when it falls into normal..
I give it a watch for the NYS open just for fun and if its nothing there, will call it the week.
I use T_S_R to show me the trend. It is helpful. It also indicates the change in trend by moving from one side of the mid line of the TMA to the other side. In the case of GBPUSD it very clearly shows that the trend has reversed.
I use two T_S_R one set to 55,2,0 and 23,2,0. It also gives an indication of how long you can stay in the traded. I do not intend to change your method in anyway
Ignored
Hi.. its ok.. but here is my opinion..
price shows the trend!!.. your own set of eyes see the PA going in one direction.. why need a indi to show that?.. unless your saying that your signal line show the trend before it actually becomes a trend!!.. well i don't believe that.. and if it does it wont be consistent it will burn you more than it benefits you... on top of it all.. will one just be confidently trading just a change of a color of a line when real money is involved... i know i won't.
in the the GU case in particular... the move could have gone either way on a blink due to news and the Db crises... it was not bcz of the s line... as a matter of fact the trend was down and if it wasn't for the news price would have continued bearish if anything else.. so s-line would have given a false premature reversal signal at best.
we use the band to ping point the OB/OS to combine it with RF to discipline the entry point.
|
Additional Username
|
Joined May 2011
|1,866 Posts
Ok folks I am done trading for the week.. I be around off and on over the weekend if you got any questions, suggestion or concerns to reply back to.
It was fun having you around today and thanks for the support and the 5 star rating, I appreciated.
I hope you have find this thread a useful one to take what you can out of it to add to your arsenal or just simply follow my foot steps. I know I have done so from other traders and threads which i am appreciative for ever.
Next week I will be super full time as I am finally geared up back to trading and to my old form of superb preparation to finish off the last a few months of the year strong as i was not well and able to do so the early part of the year over the loss of my dear father which was a big loss to me. I have finally accepted and moving on as life goes on. I dedicate this thread and all my help to others to him as i know he is watching and will be proud if i can change one financial life for better out of time.
Ok folks I am done trading for the week.. I be around off and on over the weekend if you got any questions, suggestion or concerns to reply back to.
It was fun having you around today and thanks for the support and the 5 star rating, I appreciated.
I hope you have find this thread a useful one to take what you can out of it to add to your arsenal or just simply follow my foot steps. I know I have done so from other traders and threads which i am appreciative for ever.
Next week I will be super full time as I am finally geared up back to trading...
Hi all,
Does anyone know where I can find more info on what the retracement finder indy actually is? keen to know a bit more than just buy when a blue bar appears and sell when a red bar appears.
- Look to the left, Trade to the right
- I am the system
Hi all,
Does anyone know where I can find more info on what the retracement finder indy actually is? keen to know a bit more than just buy when a blue bar appears and sell when a red bar appears.
Ignored
Hi Sebastiaan,
I got a question for you..
Are we/you buying and selling on every RF signal?
have you looked at other candle formations for confirmation of entry on "mildly striking bands", I know you are using double top/bottom
I ask because 123 reversal patterns from visually looking also seem to work, and in effect still means the rejection of the first (or few) RF signals that are countertrend to the TMA band direction
As I will be following along with your thread next week, I hope you don't mind if I test these out and post my findings here - because it could of course be just that my mind is playing the "visual backtest" tricks on me
the RF indicator is basically the Commodity Channel Index in histogram form,
the bars are colored red/blue based on the first bar in the sequence to form the "zero crossover".
I am not sure which version Dean uploaded to the thread, however some versions also perform a check on the TMA bands and the relation of price to the mid-line.
Hi all,
Does anyone know where I can find more info on what the retracement finder indy actually is? keen to know a bit more than just buy when a blue bar appears and sell when a red bar appears.
have you looked at other candle formations for confirmation of entry on "mildly striking bands", I know you are using double top/bottom
I ask because 123 reversal patterns from visually looking also seem to work, and in effect still means the rejection of the first (or few) RF signals that are countertrend to the TMA band direction
As I will be following along with your thread next week, I hope you don't mind if I test these out and post my findings here - because it could of course be just that my mind is playing the...
Ignored
Hi John.. i do not mind at all and your more than welcome to test it.
My answer to your question is.. i have looked at other stuff mostly PA formations not so much in indies, but most of everything else and especially 123 will result in two matter..
1) Late entry
2) Miss the opportunity overall, when reverses without giving out the formation.
I personally do not sweat too much the fake outs or a loss trade on that setup.. bcz the win/loss ratio is still at 50% and the rewards way surpasses the loss amounts.
next week everyone will see more of me in action.. and i will drop real time notes mostly on trade managements and show how you can take your shot and still not get burned and getaway with minimal loss for better avg loss.
but i welcome suggestions and tryouts of new stuff anytime as long as is within the core range of the threads direction.
I am thrilled to have you around next week and all the time.
the RF indicator is basically the Commodity Channel Index in histogram form,
the bars are colored red/blue based on the first bar in the sequence to form the "zero crossover".
I am not sure which version Dean uploaded to the thread, however some versions also perform a check on the TMA bands and the relation of price to the mid-line.
Regards, John
Ignored
john i use the latest one that you gave me.. the only thing i have changed is the xi-period default of 8 to 4.
|
Additional Username
|
Joined May 2011
|1,866 Posts
to everyone about RF indi..
The RF indi is not what we trade.. we trade the whole plan... all the steps must make fit before a trade to take place, and the RF is just a visual last little thing confirmation to avoid jumping the gun too early into a premature setup and rather waiting for a full candle/bar to close with a decent body.
remember the reco's that i have laid out before even looking at what RF does.. sure RF sounds.. than you can with one look to see if its even a possible signal.. if its a possible fit.. than you got 2-3 minutes before the close of the candle/bar to double check all criteria and get ready to set your pending order. This is exactly why i have set the RF xi-period to 4 instead of 8.. for early notification and buying extra time to do the last checkups to validate the setup trade and not for the purpose of early signal trading opportunity.
the last thing one should do in trading is to let his indi or holly formation or etc.. to dictate you and what you do.. and rather the other way around.. YOU to dictate everything with full control and the ability to reject the accept signals.. my plan will provide that and that's the purpose of this thread.. your the master commander.
Hi Dean,
I certainly wouldn't trade very signal the RF indi presented......but with the right filters, (i.e. PA & where it is relevant to the TMA bands) it seems like a good final trigger - as long as all the other criteria are met.
My question was more just curiosity about exactly what calculations were driving the indy.
I had a look at the source code, and it references CCI, Stochastics and the TMA bands - so i guess there's a bit going on.
seems a good indy, when combined with the overall plan.
- Look to the left, Trade to the right
- I am the system
|
Additional Username
|
Joined May 2011
|1,866 Posts
Hi,
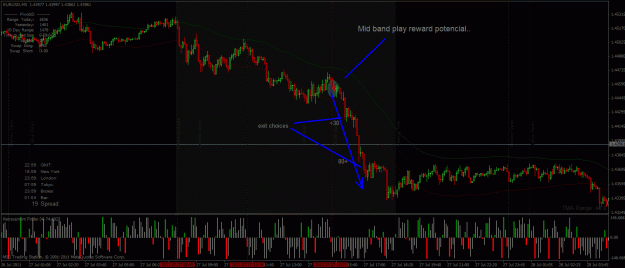
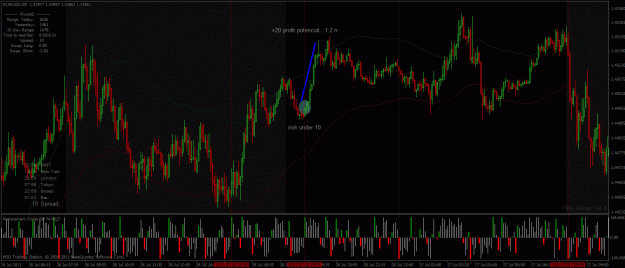
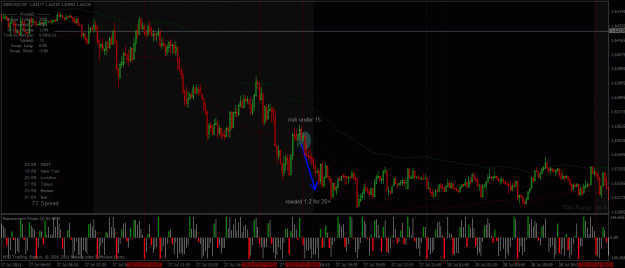
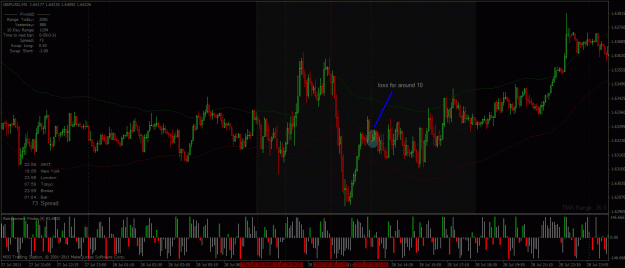
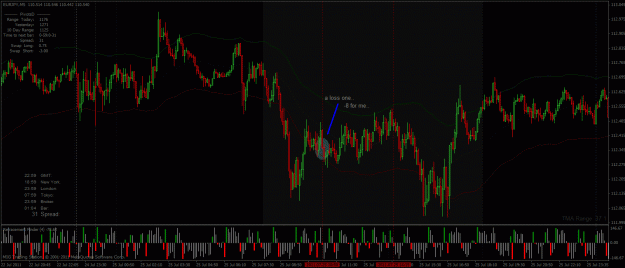
I have put together a few example of the Mid band play setup trade.. i don't want this to look like cherry picking or trying to prove something or shoved down everyone's throat.. its simply one of our other setup trade.. you can avoid it overall or trade it, its your choice.. the best thing about this style of trading is that we got other more reliable setups, full of signals for plenty of profit potential... but if you wanna be a real player and post big numbers in daily basis you got to get your hand dirty with most curves of the market, takeing full advantage and more importantly be on your way to be a fully complete and confident fearless Trader.
anyways, I have found the reward in such trade setups far out weights the losses.. and more importantly it keeps you busy in the game when the proper MOM setup on trending days that don't quite show up.
these examples are from last week.. I personally had a few winner and couple of losses as well.. and superbly ahead in win loss column.. i have shown both.
Hi Dean,
I certainly wouldn't trade very signal the RF indi presented......but with the right filters, (i.e. PA & where it is relevant to the TMA bands) it seems like a good final trigger - as long as all the other criteria are met.
My question was more just curiosity about exactly what calculations were driving the indy.
I had a look at the source code, and it references CCI, Stochastics and the TMA bands - so i guess there's a bit going on.
seems a good indy, when combined with the overall plan.
Ignored
ok, gotcha brother...
i just wanted to make sure you are on the right track out of care, which seems like you are and i am glad to see so.