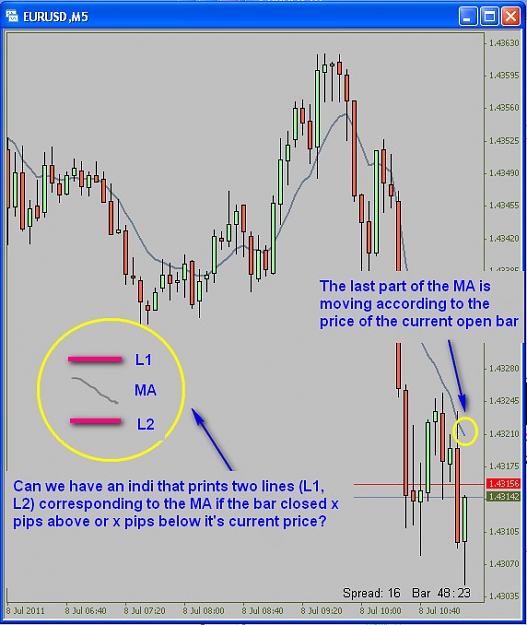
This is a request for an indi to address the problem of the moving average line of an open bar. If you are following MAs you will have noticed the following problem:
Let's say we are on M5 timeframe and we have a quick MA (e.g. EMA5, EMA10). The MA of the bar that hasn't closed yet is moving up and down as the price of the current bar fluctuates. So, if you are trading a bounce of such an MA, you don't know what the MA will look like when the bar closes. It would be extremely useful to have an indicator that plots two lines above and below the MA with a user defined pips option x. For example, if I choose x=5 pips the indicator would plot the MA for the current bar with two lines L1 and L2, where L1 would be the MA if price closed +5 pips from the current price and L2 would be the MA if price closed -5 pips from the current one.
I hope I described this clearly and if a good soul wants to code such an indi it would be great for those who use MAs.
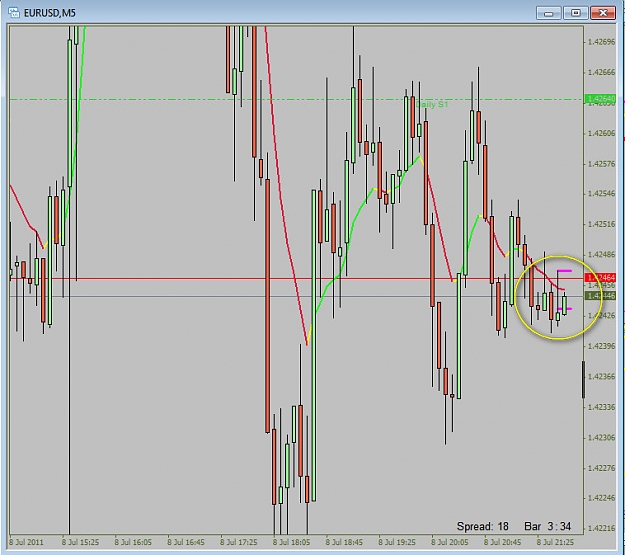
Attached Image (click to enlarge)