DislikedThis is a common question. And in my opinion, this is where most systems go wrong. Because it assumes that I, as thread starter, have an answer for every question. And it assumes that I have a one-sized-fits-all exit strategy. This is not your fault that you think like this. Every thread goes in this direction -- every one. But not this one...Ignored
thank you for showing us your strategy which I believe has a great potential. as the thread has just started I would like to ask you some questions.
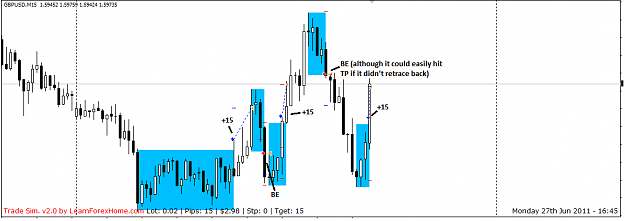
1-as a beginner of this method, the first problem for me is determining the consolidation areas in real time. for this, I ran my simulator on g/u m15 and drew a rectangle of 30 pips and followed the tops and bottoms of candles until the price get out of the box. I think my eyes will catch the movements easily in time, but is this a proper method to draw rectangles? what do you think?
2-my daily target and loss limit are both 30 pips. for this reason, I chose a standard TP point of 15 pips and a SL of 30pips in my simulated trades at first and pulled the SL point to BE at +10. what kind of TP/SL do you use? (although you mentioned that you cannot dictate everyone what to do, but I would like to know how you manage your trades)
3-the height of rectangles you draw is 30 pips. is this valid only for G/U and only for m15? if yes, how shall we determine the height for other parities and timeframes?
4-lastly, do you use any buffer to enter into trade or do you buy/sell at the moment the price just gets out of the box?
you can see some trades I did in the simulator in the attachment.
thanks in advance,
ismail...
Attached Image (click to enlarge)