That mean target should hit before 29 july?
I thought it's june LOL
if so can i modify my target?
Ignored
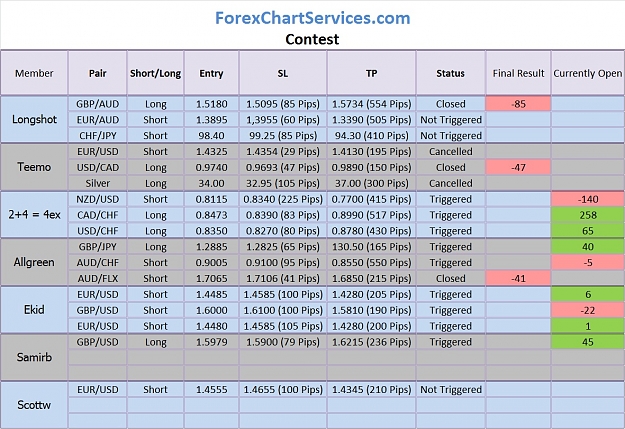
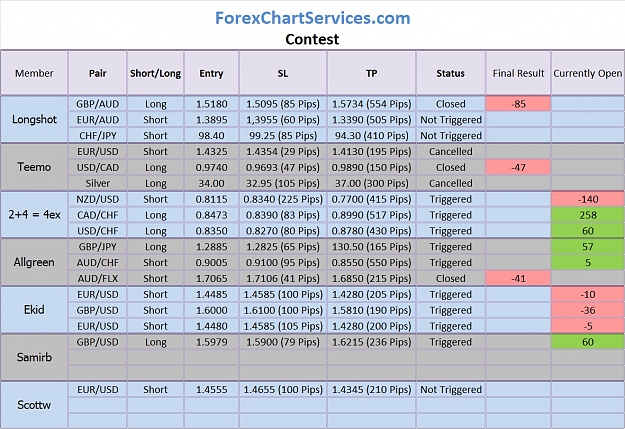
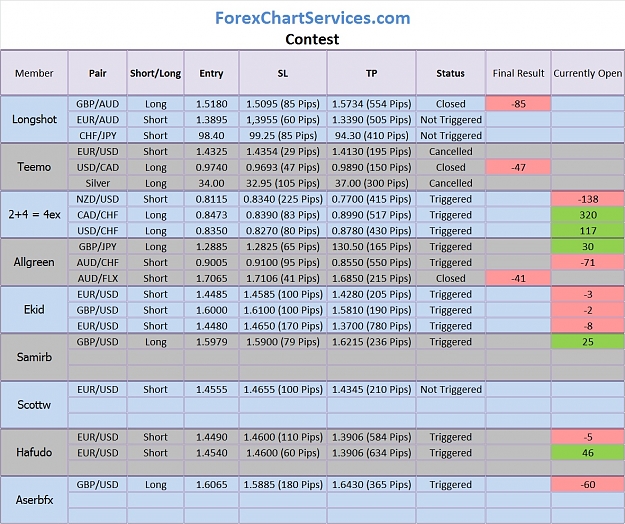
All setup's results will be compute at whatever price they are at 3:00PM on July 29th. Modifications (updates) are accepted if they are posted live (before the fact). You can close it before target, move your SL etc (as anyother trade) just let us know before you do it.
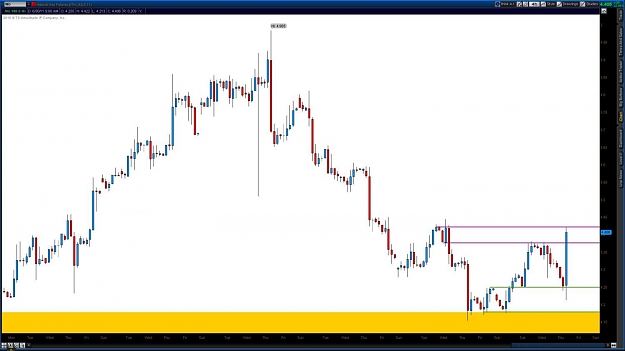
More congestion to the left side of the chart than I usually like. But if rejective PA unfolds at Demand area I'll play the range within the 1HR & 4HR picture. Price currently reacting to marked supply area and on it's way to set-up area.
Ignored
Attached Image (click to enlarge)
"As Kids we believe Anything is Possible; the Trick is to never forget it!"