Forex Price Action - Reading the Language of the Market
Follow-up.
support and resistance lines
Support and resistance lines are price levels where an ongoing trend goes through a temporary or permanent reversal. If the main trend is upward, and the price movement is halted, the level at which this pause occurs is termed a resistance level. Conversely, when the trend is downward, and the movement is reversed or halted by bids at a price level, that price level is called a support.
These levels represent clustered limit orders which exhaust the buy or sell orders of the trend’s drivers. In other words, as market buy orders are placed, driving the price higher, and also triggering previously placed limit-buy orders on their path, a price level is reached where the buyers or sellers in the market cannot exhaust the bids or offers, depending on the nature of the obstacle. This could be because the trend runs out of momentum even as the price registers new highs (and divergences appear on the indicators, while volume falls, or money flows decelerate), or because there are too many limit orders at a price which even a strong and healthy trend with good momentum is unable to exhaust. In either case, the previously mentioned price levels are called support or resistance lines, as multiple attempts to breach them fail.
Support and resistance lines are ubiquitous on the charts, but many of them are caused by the random fluctuations of the price, rather than a truly significant cluster of orders in either direction. In order to gauge the importance of a support or resistance level, the technical trader will count the number of times it resisted attempts of breakout, and classifies the levels in accordance.
One very important rule about support and resistance lines is their chameleon nature. When a support line suffers a clear breakdown, it will act like resistance level if the price action attempts to move above this level in the future. Similarly, when the price breaks out of a resistance line, it will act as a support line when the sellers attempt to drive the quote back below the price resistance.
Let’s take a brief look at these lines and how they develop.
http://www.forextraders.com/assets/a...ine-charts.gif
Note: Past performance is not indicative of future results.
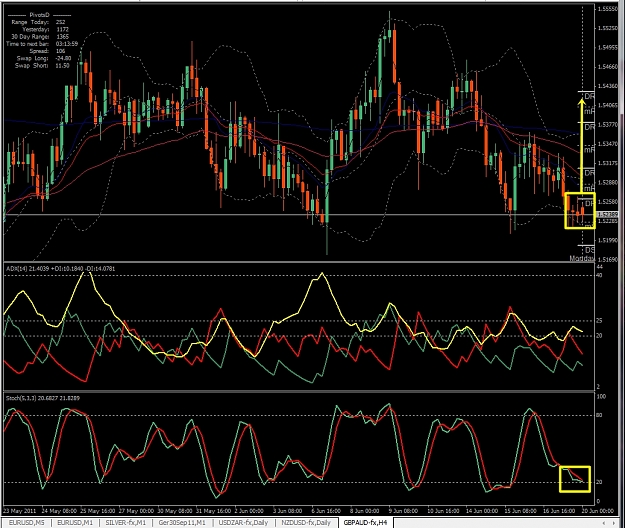
In this four-hour chart of the GBPUSD pair, we note a very sharp spike which takes the price from around 1.38 up beyond 1.45 in about a day. The first attempt to breach the major support line at 1.445 is successful, and the price manages to hold on to this previous resistance line as a support during the ensuing countertrend movement. However, the brief but large momentum of the trade is exhausted already, even as the price holds above the newly created support line duringthe many attempts to breach it by sellers which last for more than a week. Eventually, we see a somewhat difficult to identify head and shoulders pattern developing, with the reversal breaking the support line, and sending the price down.
http://www.forextraders.com/assets/a...line-chart.gif
Note: Past performance is not indicative of future results.
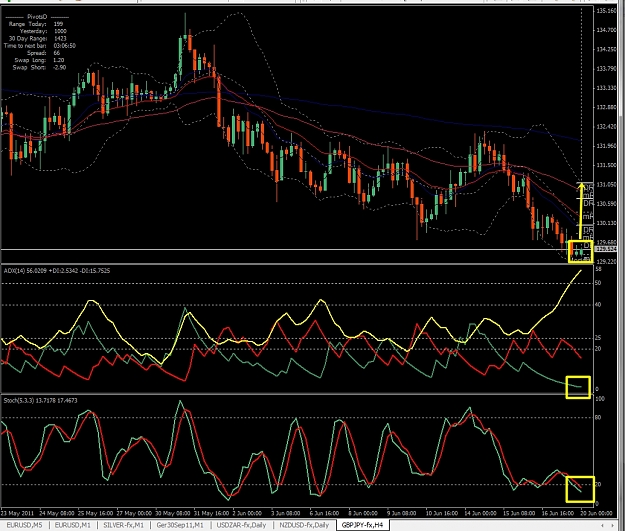
In this hourly chart of the GBPUSD pair, we have indicated a major resistance line with the red horizontal line. We observe that this hourly resistance level was checked five times at various points, and that all the attempts were failures. Only around midnight on April 2nd, was a significant breach of the resistance line achieved, but the breakout was invalidated as more and more sellers forced the price back under the resistance line. Naturally, when the breakout did occur, it was sharp and powerful, with the price rallying strongly, with the resistance line also acting as a support level when the sellers attempted to check the strength of the ongoing uptrend, as observed on this chart.
a. Sideways trend, consolidation
A consolidation pattern, or a sideways trend occurs when the price settles into a relatively tight range between a support and a resistance level, and remains there for a long time. A true consolidation pattern usually lasts more than ten bars at the very least, but as with all rules in technical analysis, it is possible to identify consolidation phases that last much shorter. Still, in this text we’ll examine the true consolidation pattern which lasts long, reduces volatility significantly, and is confined between a support and resistance level.
As its name suggests, the pattern represents a phase during which volume falls, money flows diminish, and the indicators all retreat to the signal line, or the center value. For example, the Williams oscillator approaches zero, while the RSI settles at a level close to 50. In its purest form the consolidation pattern represents a frozen market where the ongoing trade activity is netted out, that is, buyers and sellers are in complete equilibrium. Such a situation is a very rare in the markets, and of course it cannot be maintained indefinitely. When the pattern breaks down,, the ensuing price movement is rapid, with volatility, and volume increasing in harmony.
Consolidations usually occur as the market awaits news releases or important economic data that can have an important impact on the future price trends. Traders are nervous and indecisive, but this attitude is not born of any misgivings on the strength or justification for the ongoing trend itself. Instead, attention is directed to the market-moving data and the aim is to maximize profits, as soon as the other market’s expectations are confirmed by the developments.
http://www.forextraders.com/assets/a...tion-chart.gif
Note: Past performance is not indicative of future results.
In this hourly chart of the EURCHF pair, we notice the price fluctuating between 1.457, and 1.483, as show by the horizontal red lines. As a range pattern, the price action is not very volatile, but we still do not see the very subdued price movement that represents a true consolidation pattern. Yet, as we move further to the right on the chart, between 10th March 9 am, and 12th March 9am, when the price registers a massive breakout, we see both the stochastics indicator, and the price settle to a very subdued pattern which signifies that the upward movement from the support level at 1.457 is going through a consolidation phase. The value of the stochastics indicator settles around 50, as seen on the chart.
When the eventual breakout occurs, it’s very violent ant rapid, and fully confirms our expectation that the price action following a true consolidation phase will be rapid, sharp, and powerful. It is highly likely, judging from the nature of the spike and its duration, that the catalyzing news flow confirmed the expectations of the market, with the traders moving very fast to capitalize and build up on their positions.
b. Range patterns
Now that we know what a support and resistance line are, we can discuss the ranges formed by the price fluctuating between two such levels. Range patterns are created when there’s no overwhelming opinion among market participants on where the price should be headed. Consequently, money flows, buy and sell orders are in equilibrium with each other, but this situation becomes established only at the support and resistance lines themselves. Otherwise, during the oscillations inside the confines of a range pattern, the equilibrium is disrupted, and the price can move in either direction depending on the usual market dynamics.
As ranges develop, indicators also establish an oscillating pattern. The best way of exploiting this situation is to identify the bounds of the range on the price chart,.and to couple that with confirmation signals received from the indicators. Sometimes the breakdown of the price range is coupled with a divergence between the price action, and the indicator; the trader should do his best to capture such developments.
It is often said that range patterns provide the greatest risk/reward potential for traders, as the entry and exit points are clearly defined, and the volatility in between allows the realization of maximal profits. The certainties that a strong range pattern offer to the trader are undoubtedly useful, but the problem is with identifying these formations before they have already broken down.
How to identify a profitable range pattern with technical tools? There’s no method which can create constantly profitable results, but there are a few principles that will help you reduce the risk of a false trade. Most traders won’t trade a range unless it is confirmed with at least one candlestick in the direction of the anticipated reversal at the support or resistance lines. For example, when the price fails to breach a previous top that defines the limit of the range, the trader will await confirmation through a large bearish candlestick which will confirm that the trend has reversed. It is also possible to use the Fibonacci retracement levels for trading inside the range, without worrying about the resilience of the support or resistance lines that define the range formation itself.
http://www.forextraders.com/assets/a...tion-chart.gif
Note: Past performance is not indicative of future results.
We have studied this chart before, but because the formation is so clear, we will use it once more while discussing the range pattern. Ir is an hourly chart of the EURCHF pair, showing one breakout that connects two successive ranges. During the first range which develops between March 4th and March 12th, we note the price moving with a gentle slope and mild speed between the two support and resistance lines at 1.457, and 1.4836. The upper and lower limits of the price action (support/resistance lines, in other words) are touched five times during this pattern, and the final, 5th one results in a breakout which takes the price to much higher levels in a short time.
Not only does the breakout eliminate a previous range pattern, as seen on the lower part of the chart, but once the sharp movements of the breakout die out, the resulting formation is another range pattern too. You can try to draw the support and resistance lines on the chart visually, if you like, as a kind of exercise. Thus, in this case, the price has been leaping from one range to another, consolidating before going on with its movement. The second range formation on the upper side of the chart also resembles a flag pattern, but we cannot be sure of that, since we don’t know what happened in the aftermath of the second range breakdown.
c. Breakouts
After discussing the various range patterns, consolidations and continuation formations, we can now briefly examine breakouts. As we all know, no support or resistance line will be able capable of halting the price action indefinitely, and no range pattern can remain valid forever. Sooner or later, the range will be breached either upwards or downwards, and the price will keep registering new lows or highs. Breakout is the name given to this process, where the range breaks down, the price jumps in a fast and sharp movement, and sometimes price gaps occur.
Breakouts are not predicted, but confirmed by indicators such as the Bollinger band, as volatility increases, bullish or bearish crossovers occur, range patterns break down, and the price begins a rapid movement to either side. While it may be possible to anticipate that a breakout will occurs, in the absence of special situations like divergences, it is very difficult to anticipate the direction of the breakout. For example, on day with an important news release, everyone knows that a breakout is highly likely at around 8 am New York time, but few can be confident about the direction.
Breakouts are like double-edged swords. The violent nature of the price ensures that both the risk and reward will be equally high.
Let’s examine the breakout on one of the previously studied charts.
http://www.forextraders.com/assets/a...tion-chart.gif
Note: Past performance is not indicative of future results.
On this beautiful hourly chart which offers a very clear breakout between two successive range patterns, we notice the price leaping from 1.4836 right up to 1.5304, as the previous range that had constrained the price action breaks down. We note that the stochastics indicator prepared the breakout by moving from a level around 50 to 30 just prior to the violent price movement, and then moved to a value close to 90 as the breakout ran its course. We also note that the price is squeezed in a very tight range before the breakout.
In comparison, the above is an exceptionally clear-cut sample, and it is unusual to find such a well-defined pattern on the charts where the breakout is prepared clearly, and occurs with great power, as the price action never looks back. In many cases, we must use our own judgement, and make some arbitrary choices before the reliability of the pattern is established.
Exploiting this breakout, we’d place our stop loss order at a value below 50 on the stochastics indicator, and our take profit order would be placed at between 80 and 90 on the same chart, in order to profit from the price action to the maximum extent.
Conclusion
On a concluding note, let us note that the various technical patterns which we have discussed here do not provide us infallible solutions to our problems. In many cases, we need confirmation from different technical or fundamental sources before we can establish credible scenarios that can be acted upon. As this text aims to present technical solutions to the problem of identifying credible profit/loss opportunities, we have not concerned ourselves with the various fundamental approaches to the problems discussed.
What is the use of these patterns? They are used to analyze market psychology during the different phases of a trend. Although market psychology is volatile, and unreliable as a guide of market direction, it’s the only force deciding short term events, and the only tool the trader has with any kind of predictive capability in that time frame.
It is possible to have a descending triangle as a continuation pattern on an uptrend, as a reversal pattern on a downtrend, as well as a reversal pattern on an uptrend. It is important to keep in mind that the descriptions in this text are all generalizations.
Risk Statement: Trading Foreign Exchange on margin carries a high level of risk and may not be suitable for all investors. The possibility exists that you could lose more than your initial deposit. The high degree of leverage can work against you as well as for you.
http://www.forextraders.com/forex-an...he-market.html
Follow-up.
support and resistance lines
Support and resistance lines are price levels where an ongoing trend goes through a temporary or permanent reversal. If the main trend is upward, and the price movement is halted, the level at which this pause occurs is termed a resistance level. Conversely, when the trend is downward, and the movement is reversed or halted by bids at a price level, that price level is called a support.
These levels represent clustered limit orders which exhaust the buy or sell orders of the trend’s drivers. In other words, as market buy orders are placed, driving the price higher, and also triggering previously placed limit-buy orders on their path, a price level is reached where the buyers or sellers in the market cannot exhaust the bids or offers, depending on the nature of the obstacle. This could be because the trend runs out of momentum even as the price registers new highs (and divergences appear on the indicators, while volume falls, or money flows decelerate), or because there are too many limit orders at a price which even a strong and healthy trend with good momentum is unable to exhaust. In either case, the previously mentioned price levels are called support or resistance lines, as multiple attempts to breach them fail.
Support and resistance lines are ubiquitous on the charts, but many of them are caused by the random fluctuations of the price, rather than a truly significant cluster of orders in either direction. In order to gauge the importance of a support or resistance level, the technical trader will count the number of times it resisted attempts of breakout, and classifies the levels in accordance.
One very important rule about support and resistance lines is their chameleon nature. When a support line suffers a clear breakdown, it will act like resistance level if the price action attempts to move above this level in the future. Similarly, when the price breaks out of a resistance line, it will act as a support line when the sellers attempt to drive the quote back below the price resistance.
Let’s take a brief look at these lines and how they develop.
http://www.forextraders.com/assets/a...ine-charts.gif
Note: Past performance is not indicative of future results.
In this four-hour chart of the GBPUSD pair, we note a very sharp spike which takes the price from around 1.38 up beyond 1.45 in about a day. The first attempt to breach the major support line at 1.445 is successful, and the price manages to hold on to this previous resistance line as a support during the ensuing countertrend movement. However, the brief but large momentum of the trade is exhausted already, even as the price holds above the newly created support line duringthe many attempts to breach it by sellers which last for more than a week. Eventually, we see a somewhat difficult to identify head and shoulders pattern developing, with the reversal breaking the support line, and sending the price down.
http://www.forextraders.com/assets/a...line-chart.gif
Note: Past performance is not indicative of future results.
In this hourly chart of the GBPUSD pair, we have indicated a major resistance line with the red horizontal line. We observe that this hourly resistance level was checked five times at various points, and that all the attempts were failures. Only around midnight on April 2nd, was a significant breach of the resistance line achieved, but the breakout was invalidated as more and more sellers forced the price back under the resistance line. Naturally, when the breakout did occur, it was sharp and powerful, with the price rallying strongly, with the resistance line also acting as a support level when the sellers attempted to check the strength of the ongoing uptrend, as observed on this chart.
a. Sideways trend, consolidation
A consolidation pattern, or a sideways trend occurs when the price settles into a relatively tight range between a support and a resistance level, and remains there for a long time. A true consolidation pattern usually lasts more than ten bars at the very least, but as with all rules in technical analysis, it is possible to identify consolidation phases that last much shorter. Still, in this text we’ll examine the true consolidation pattern which lasts long, reduces volatility significantly, and is confined between a support and resistance level.
As its name suggests, the pattern represents a phase during which volume falls, money flows diminish, and the indicators all retreat to the signal line, or the center value. For example, the Williams oscillator approaches zero, while the RSI settles at a level close to 50. In its purest form the consolidation pattern represents a frozen market where the ongoing trade activity is netted out, that is, buyers and sellers are in complete equilibrium. Such a situation is a very rare in the markets, and of course it cannot be maintained indefinitely. When the pattern breaks down,, the ensuing price movement is rapid, with volatility, and volume increasing in harmony.
Consolidations usually occur as the market awaits news releases or important economic data that can have an important impact on the future price trends. Traders are nervous and indecisive, but this attitude is not born of any misgivings on the strength or justification for the ongoing trend itself. Instead, attention is directed to the market-moving data and the aim is to maximize profits, as soon as the other market’s expectations are confirmed by the developments.
http://www.forextraders.com/assets/a...tion-chart.gif
Note: Past performance is not indicative of future results.
In this hourly chart of the EURCHF pair, we notice the price fluctuating between 1.457, and 1.483, as show by the horizontal red lines. As a range pattern, the price action is not very volatile, but we still do not see the very subdued price movement that represents a true consolidation pattern. Yet, as we move further to the right on the chart, between 10th March 9 am, and 12th March 9am, when the price registers a massive breakout, we see both the stochastics indicator, and the price settle to a very subdued pattern which signifies that the upward movement from the support level at 1.457 is going through a consolidation phase. The value of the stochastics indicator settles around 50, as seen on the chart.
When the eventual breakout occurs, it’s very violent ant rapid, and fully confirms our expectation that the price action following a true consolidation phase will be rapid, sharp, and powerful. It is highly likely, judging from the nature of the spike and its duration, that the catalyzing news flow confirmed the expectations of the market, with the traders moving very fast to capitalize and build up on their positions.
b. Range patterns
Now that we know what a support and resistance line are, we can discuss the ranges formed by the price fluctuating between two such levels. Range patterns are created when there’s no overwhelming opinion among market participants on where the price should be headed. Consequently, money flows, buy and sell orders are in equilibrium with each other, but this situation becomes established only at the support and resistance lines themselves. Otherwise, during the oscillations inside the confines of a range pattern, the equilibrium is disrupted, and the price can move in either direction depending on the usual market dynamics.
As ranges develop, indicators also establish an oscillating pattern. The best way of exploiting this situation is to identify the bounds of the range on the price chart,.and to couple that with confirmation signals received from the indicators. Sometimes the breakdown of the price range is coupled with a divergence between the price action, and the indicator; the trader should do his best to capture such developments.
It is often said that range patterns provide the greatest risk/reward potential for traders, as the entry and exit points are clearly defined, and the volatility in between allows the realization of maximal profits. The certainties that a strong range pattern offer to the trader are undoubtedly useful, but the problem is with identifying these formations before they have already broken down.
How to identify a profitable range pattern with technical tools? There’s no method which can create constantly profitable results, but there are a few principles that will help you reduce the risk of a false trade. Most traders won’t trade a range unless it is confirmed with at least one candlestick in the direction of the anticipated reversal at the support or resistance lines. For example, when the price fails to breach a previous top that defines the limit of the range, the trader will await confirmation through a large bearish candlestick which will confirm that the trend has reversed. It is also possible to use the Fibonacci retracement levels for trading inside the range, without worrying about the resilience of the support or resistance lines that define the range formation itself.
http://www.forextraders.com/assets/a...tion-chart.gif
Note: Past performance is not indicative of future results.
We have studied this chart before, but because the formation is so clear, we will use it once more while discussing the range pattern. Ir is an hourly chart of the EURCHF pair, showing one breakout that connects two successive ranges. During the first range which develops between March 4th and March 12th, we note the price moving with a gentle slope and mild speed between the two support and resistance lines at 1.457, and 1.4836. The upper and lower limits of the price action (support/resistance lines, in other words) are touched five times during this pattern, and the final, 5th one results in a breakout which takes the price to much higher levels in a short time.
Not only does the breakout eliminate a previous range pattern, as seen on the lower part of the chart, but once the sharp movements of the breakout die out, the resulting formation is another range pattern too. You can try to draw the support and resistance lines on the chart visually, if you like, as a kind of exercise. Thus, in this case, the price has been leaping from one range to another, consolidating before going on with its movement. The second range formation on the upper side of the chart also resembles a flag pattern, but we cannot be sure of that, since we don’t know what happened in the aftermath of the second range breakdown.
c. Breakouts
After discussing the various range patterns, consolidations and continuation formations, we can now briefly examine breakouts. As we all know, no support or resistance line will be able capable of halting the price action indefinitely, and no range pattern can remain valid forever. Sooner or later, the range will be breached either upwards or downwards, and the price will keep registering new lows or highs. Breakout is the name given to this process, where the range breaks down, the price jumps in a fast and sharp movement, and sometimes price gaps occur.
Breakouts are not predicted, but confirmed by indicators such as the Bollinger band, as volatility increases, bullish or bearish crossovers occur, range patterns break down, and the price begins a rapid movement to either side. While it may be possible to anticipate that a breakout will occurs, in the absence of special situations like divergences, it is very difficult to anticipate the direction of the breakout. For example, on day with an important news release, everyone knows that a breakout is highly likely at around 8 am New York time, but few can be confident about the direction.
Breakouts are like double-edged swords. The violent nature of the price ensures that both the risk and reward will be equally high.
Let’s examine the breakout on one of the previously studied charts.
http://www.forextraders.com/assets/a...tion-chart.gif
Note: Past performance is not indicative of future results.
On this beautiful hourly chart which offers a very clear breakout between two successive range patterns, we notice the price leaping from 1.4836 right up to 1.5304, as the previous range that had constrained the price action breaks down. We note that the stochastics indicator prepared the breakout by moving from a level around 50 to 30 just prior to the violent price movement, and then moved to a value close to 90 as the breakout ran its course. We also note that the price is squeezed in a very tight range before the breakout.
In comparison, the above is an exceptionally clear-cut sample, and it is unusual to find such a well-defined pattern on the charts where the breakout is prepared clearly, and occurs with great power, as the price action never looks back. In many cases, we must use our own judgement, and make some arbitrary choices before the reliability of the pattern is established.
Exploiting this breakout, we’d place our stop loss order at a value below 50 on the stochastics indicator, and our take profit order would be placed at between 80 and 90 on the same chart, in order to profit from the price action to the maximum extent.
Conclusion
On a concluding note, let us note that the various technical patterns which we have discussed here do not provide us infallible solutions to our problems. In many cases, we need confirmation from different technical or fundamental sources before we can establish credible scenarios that can be acted upon. As this text aims to present technical solutions to the problem of identifying credible profit/loss opportunities, we have not concerned ourselves with the various fundamental approaches to the problems discussed.
What is the use of these patterns? They are used to analyze market psychology during the different phases of a trend. Although market psychology is volatile, and unreliable as a guide of market direction, it’s the only force deciding short term events, and the only tool the trader has with any kind of predictive capability in that time frame.
It is possible to have a descending triangle as a continuation pattern on an uptrend, as a reversal pattern on a downtrend, as well as a reversal pattern on an uptrend. It is important to keep in mind that the descriptions in this text are all generalizations.
Risk Statement: Trading Foreign Exchange on margin carries a high level of risk and may not be suitable for all investors. The possibility exists that you could lose more than your initial deposit. The high degree of leverage can work against you as well as for you.
http://www.forextraders.com/forex-an...he-market.html