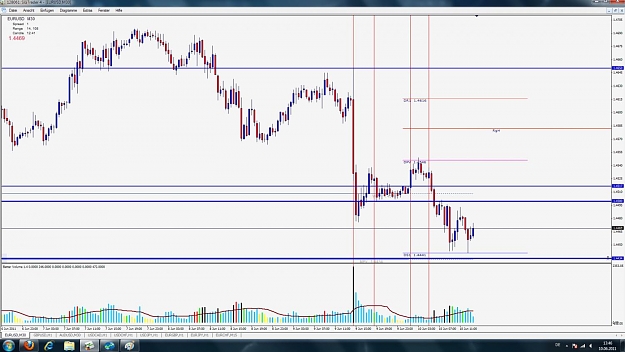
Is the bar under my red arrow is a no demand bar?
It is a down bar , volume lower than 2 previous bars.
After strength in the background.
It is a down bar , volume lower than 2 previous bars.
After strength in the background.
Attached Image (click to enlarge)