Here is an advanced technique. I would suggest if you are a newbie to learn the basic trading entry before attempting this trade. For those people who understand divergence here is an advanced trade entry that will just give you more confidence and confirm your entry.
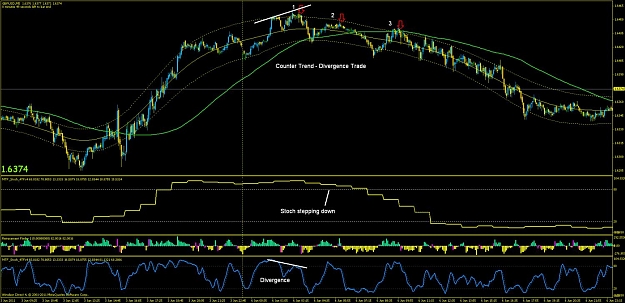
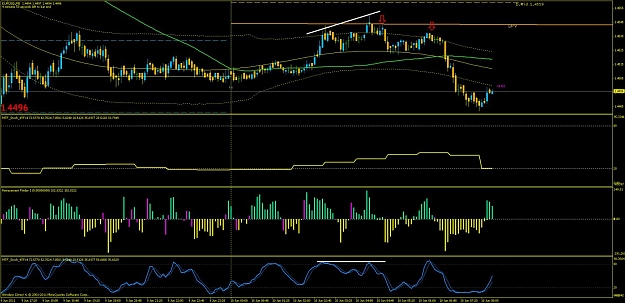
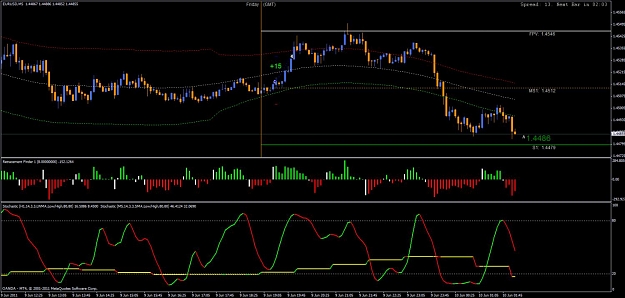
On the 5M chart add the MTF Stoch and set it to 5 minutes so it reflects the candle formation on the 5 M chart. Now take a look at my picture. We have a long up trend and price starts to weaken and and lose momentum. When you see this start to look at the 5M stoch. As you can see we have higher highs on price but lower highs on the 5M stoch. Once I see this I start to look for pullbacks that don't exceed the last high. Examine the chart closely and you'll see 3 entries. Entry 1 is the most aggressive. It's taken with a minor pullback to the top band and price does not go higher then the last high. Entry 2 is after we had a touch of the bottom band and a pullback to the top band. When price reaches the top band I start to look for PA and the entry short. After entry 2 price goes to the bottom band and again pulls back to the top band. I follow the same process each time. Observe price action when price gets to the top band. When I see a nice bearish candle we have entry #3 which is the most conservative. Price is making lower highs as we move down. Notice the retracement indicator on each of the pullbacks...what is it doing??? Notice the 60 min Stoch, see how it is stepping down as we take these trades.
This is a picture perfect counter trend trade that turns into a full reversal that goes for the entire day on the 5 M chart.
Attached Image (click to enlarge)