theories about the market and understanding the forex market.
binary system: the forex market is comprised of 2 forces only, buy/sell, in logic this leads me to believe that identifying
the preasure and strength of these two powerful forces, and understanding when each force is not in equilibrium is what
will assist in understanding the behaviour of the market. Many systems are based on prediction of price and price levels.
where price might be at a certain point and time. some a based on the direction of price movement.
in my observations of price behaviour the logic of the market is such, buy or sell, if not selling then that indicates
the reduce selling force at the time, if not buying the buying force is reduced.
one needs to understand supply and demand at its purest form.
supply is the quatity available and demand is the desire to adquire it.
market equilibrium is reached when the quantity demanded by consumers is equal to the quantity supplied.
what does this mean in terms of understanding the forex market. i make the deduction that a reduction in volatility and a
narrowing in price quotes, indicate market equilibrium. i have made the observation that after a period of reduced volaitility
comes a period of increased volatility. when market equilibrium is broken by increase in orders of buy or sell.
this observation was also made by Bollinger leading to the widening and narrowing of the bands, for this observation however
i have no practical purpose i have not yet understood the power in its meaning, however, it correlates well with
market times, asian roll over, london open, new york open and the overlapping of both. in my observations i have seen
that players close their books and positions, or market swings are very pronounced sometimes counter trend sometimes, strong
trend moves.
However in Heaven, knowing times and seasons, this can prove to be of interest, as here is where much of the big pip movement
occurs, and if one can observe be nimble and be able to catch this moves, the book can be augmented.
(For non TAF followers, my M.O attempts to be in line with the art of war, and the idea is that the market is too complex to be predicted by indicators, chart patterns, or indicators, all indicators have purpose. the key is understanding what they calculate. the market structure in a nutshell is comprised of The Fed, Central banks, Tier 1,2,3 banks, corporations, investment entities, hedge funds, insurances and companies, retail brokers and traders, common people holding money and so on. so a formula or indicator to predict this is fallacy. in summery on needs to dance in tune with the market, and let her guide you) my observations here are an attempt to decipher the market pulse, rhythm or flow.
there is much talk about trend. but what is a trend? dow theory states that there are trends within trends, and movement of
price is comprised of short term, mid term and long term. long term i understand it to be the broad fundamental economic
picture and general direction of price movement.for my purposes dow's theories are useful to me in short sense
my broad picture comes in form of the daily read (weekly and monthly are too long term for me but one needs not discount
anything, "as above so below") in my observations long term movement might not be practical but one needs to know the terrain
a persistent bull market, indicates a persistent environment where buy orders are greater than sell orders.
in my observations i believe that the most important Time frame ( if one believes in such thing) is the TICk, an organism
is not form from big to small but from small to big. the longer time frames will reflect the movement of price in certain amount of time
after so much time has passed, so 1 minute, reflects the amount of ticks in a minute 5 minutes the movement in 5 minutes
1 hr, the amount of movement in 60 minutes, 1 day the amount of movement in 1440 minutes, the forex market is opened for 5.5 days
, so one week is 7920 minutes and one month is 31680 minutes.
so while it is true that the tick will determine the month, the month measures the general movement of the tick.....this
leads me to beleive that all time frames are important, but the longer the time frame the more prediction comes into play.
unless we are using the longer time frame to measure the lower ones not predict them.
in the aspect of trend, higher lows, higher highs, or a persistent movement in one direction. as stated above the unbalanced
force of either buy or sell. however this also leads me to believe that price has direction, if we are able to observe
the direction, one might have an advantage. (first: identify direction, must be the order of business)
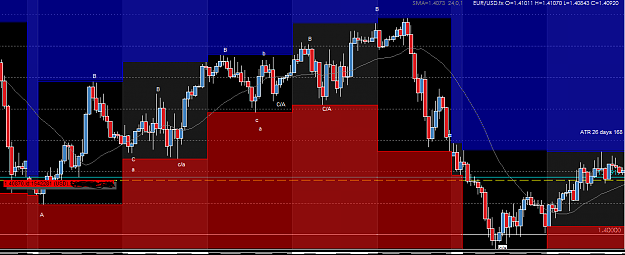
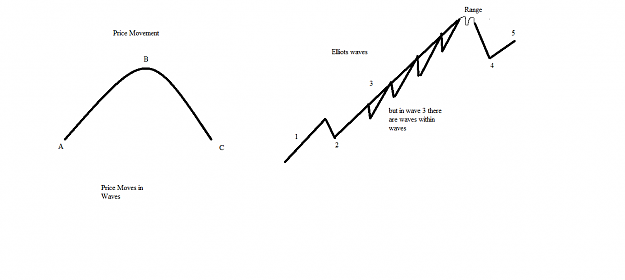
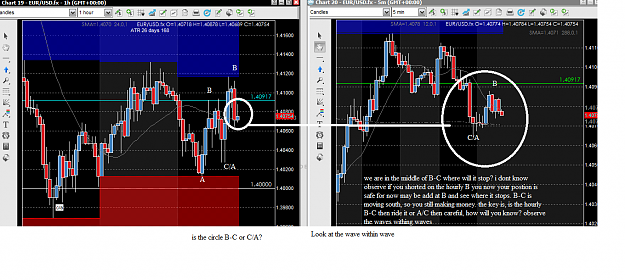
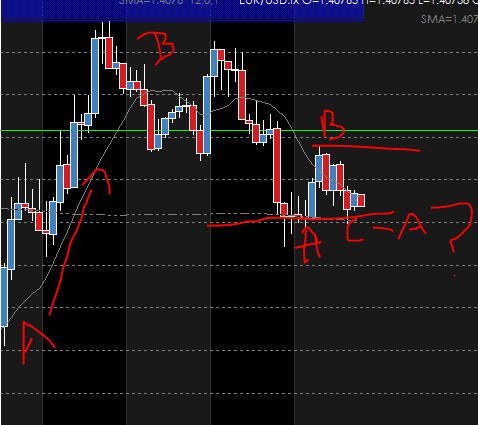
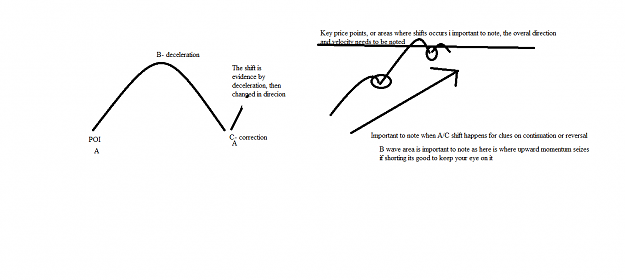
in my observations i have found that price indeed moves in waves, some times not perfect waves, but it MUST follow three
aspects A= acceleration in towards B= the loss of momentum after then C= correction. observing the three individually
and the force of each can be a visual aid and key in the read of further downward movement or continuation upward.
example A-B acceleration the losses mommentum (can be visually calculated by candles) then a distribution or topping motion which is B
then accelerates to C the corrective move (again the transition to A comes with loss of momentum) the A again in a rythmic
tempo of ABCABCABCABCABC ( now it is KEY to point out that price is not a perfect uniform wave with equal direction,amplitude and velocity)
that is why i have found this observation tool very promising because the strenght,and thrust of each respective phase
helps in calculating the Force of supply and demand. (the observation method follows three laws abc, after A, B must come, after B, C must come, and after c A must be repeated)
sometimes C is weak and almost none existent but it is there none the less (sell orders ALWAYS happen) the streght of this
move signals continuation of demand.
binary system: the forex market is comprised of 2 forces only, buy/sell, in logic this leads me to believe that identifying
the preasure and strength of these two powerful forces, and understanding when each force is not in equilibrium is what
will assist in understanding the behaviour of the market. Many systems are based on prediction of price and price levels.
where price might be at a certain point and time. some a based on the direction of price movement.
in my observations of price behaviour the logic of the market is such, buy or sell, if not selling then that indicates
the reduce selling force at the time, if not buying the buying force is reduced.
one needs to understand supply and demand at its purest form.
supply is the quatity available and demand is the desire to adquire it.
market equilibrium is reached when the quantity demanded by consumers is equal to the quantity supplied.
what does this mean in terms of understanding the forex market. i make the deduction that a reduction in volatility and a
narrowing in price quotes, indicate market equilibrium. i have made the observation that after a period of reduced volaitility
comes a period of increased volatility. when market equilibrium is broken by increase in orders of buy or sell.
this observation was also made by Bollinger leading to the widening and narrowing of the bands, for this observation however
i have no practical purpose i have not yet understood the power in its meaning, however, it correlates well with
market times, asian roll over, london open, new york open and the overlapping of both. in my observations i have seen
that players close their books and positions, or market swings are very pronounced sometimes counter trend sometimes, strong
trend moves.
However in Heaven, knowing times and seasons, this can prove to be of interest, as here is where much of the big pip movement
occurs, and if one can observe be nimble and be able to catch this moves, the book can be augmented.
(For non TAF followers, my M.O attempts to be in line with the art of war, and the idea is that the market is too complex to be predicted by indicators, chart patterns, or indicators, all indicators have purpose. the key is understanding what they calculate. the market structure in a nutshell is comprised of The Fed, Central banks, Tier 1,2,3 banks, corporations, investment entities, hedge funds, insurances and companies, retail brokers and traders, common people holding money and so on. so a formula or indicator to predict this is fallacy. in summery on needs to dance in tune with the market, and let her guide you) my observations here are an attempt to decipher the market pulse, rhythm or flow.
there is much talk about trend. but what is a trend? dow theory states that there are trends within trends, and movement of
price is comprised of short term, mid term and long term. long term i understand it to be the broad fundamental economic
picture and general direction of price movement.for my purposes dow's theories are useful to me in short sense
my broad picture comes in form of the daily read (weekly and monthly are too long term for me but one needs not discount
anything, "as above so below") in my observations long term movement might not be practical but one needs to know the terrain
a persistent bull market, indicates a persistent environment where buy orders are greater than sell orders.
in my observations i believe that the most important Time frame ( if one believes in such thing) is the TICk, an organism
is not form from big to small but from small to big. the longer time frames will reflect the movement of price in certain amount of time
after so much time has passed, so 1 minute, reflects the amount of ticks in a minute 5 minutes the movement in 5 minutes
1 hr, the amount of movement in 60 minutes, 1 day the amount of movement in 1440 minutes, the forex market is opened for 5.5 days
, so one week is 7920 minutes and one month is 31680 minutes.
so while it is true that the tick will determine the month, the month measures the general movement of the tick.....this
leads me to beleive that all time frames are important, but the longer the time frame the more prediction comes into play.
unless we are using the longer time frame to measure the lower ones not predict them.
in the aspect of trend, higher lows, higher highs, or a persistent movement in one direction. as stated above the unbalanced
force of either buy or sell. however this also leads me to believe that price has direction, if we are able to observe
the direction, one might have an advantage. (first: identify direction, must be the order of business)
in my observations i have found that price indeed moves in waves, some times not perfect waves, but it MUST follow three
aspects A= acceleration in towards B= the loss of momentum after then C= correction. observing the three individually
and the force of each can be a visual aid and key in the read of further downward movement or continuation upward.
example A-B acceleration the losses mommentum (can be visually calculated by candles) then a distribution or topping motion which is B
then accelerates to C the corrective move (again the transition to A comes with loss of momentum) the A again in a rythmic
tempo of ABCABCABCABCABC ( now it is KEY to point out that price is not a perfect uniform wave with equal direction,amplitude and velocity)
that is why i have found this observation tool very promising because the strenght,and thrust of each respective phase
helps in calculating the Force of supply and demand. (the observation method follows three laws abc, after A, B must come, after B, C must come, and after c A must be repeated)
sometimes C is weak and almost none existent but it is there none the less (sell orders ALWAYS happen) the streght of this
move signals continuation of demand.
AVT INVENIAM VIAM AVT FACIAM