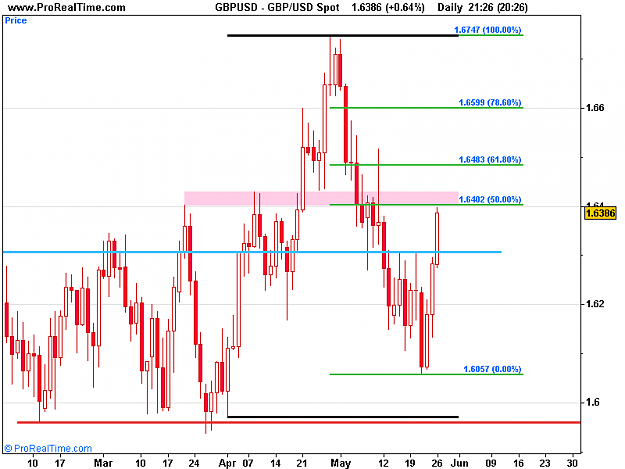
DislikedI would agree with bull camp for GU if we have a full
daily close above ~1.64.
And weekly is not closed yet.
I`am at bear camp for GU - not in a trade yet.Ignored
i agree of 1.6400 a pivot price at present..
baz
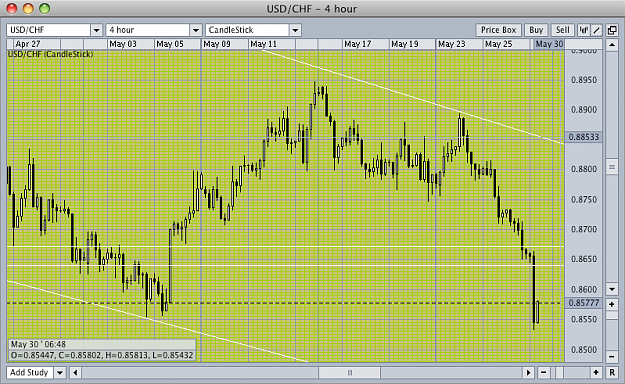
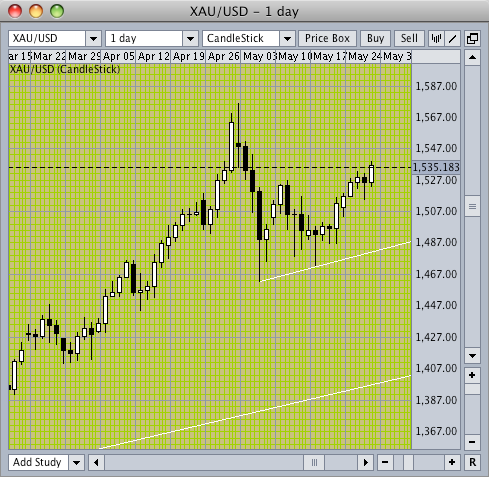
USD Spot.png
Attached Image (click to enlarge)