So this raises the question have we seen distribution?
Ignored
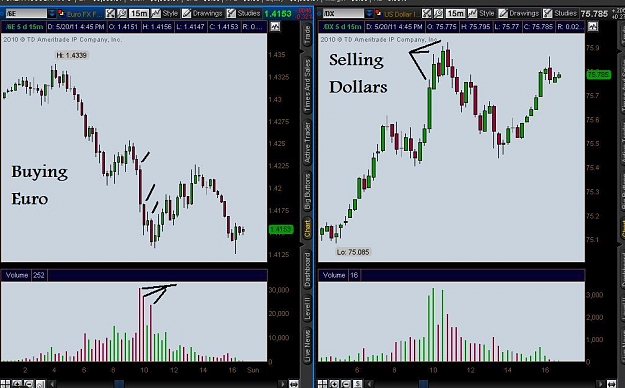
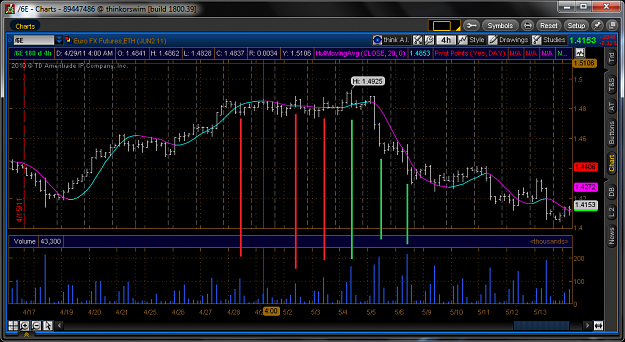
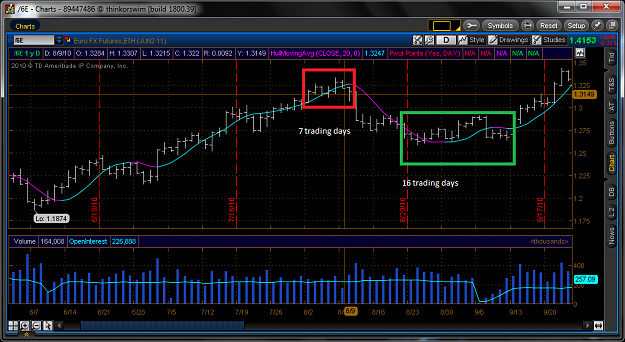
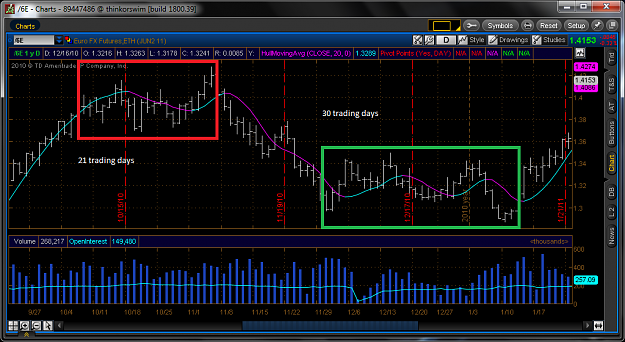
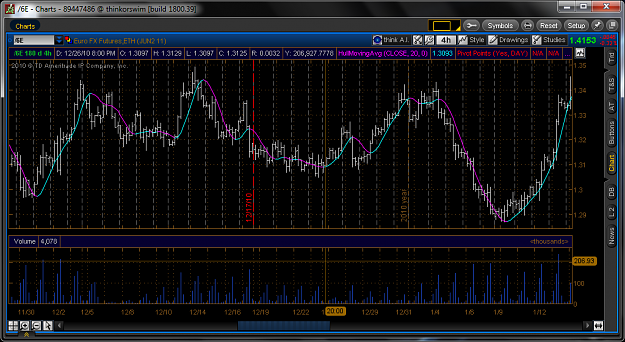
I guess that would depend on what time frame you are talking about. If you are talking about daily then yes we have already seen it, started on 4/28. First attachment is the 4/28 distribution, red lines are testing for buyers, green lines are being hit with sell orders. Distribution is funny, Im sure its in MTM, been watching some of Kruegers videos this week, and he says distribution happens quick as well as the mark downs. Also mentions that when it comes to dist has to happen after a up move and acc after a down move. The rest are screenshots that I made for myself, showing distribution followed by accumulation. First one should be from august of last year and second is november to january.
I guess that would depend on what time frame you are talking about.
Ignored
So if you were asking about dist for the week then for me I would say no for my time frame.
That there was never any accumulation from a daily perspective, that took place.
First screenie is a 4h that showing average volume being somewhere around 130ish for 6e.
Second screenie is from the accumulation fro jan, which the average is 206.
I think most people here are in agreement that we will see the euro 1.6xxx sometime next year if SM was ready to acc wouldnt the volume be higher??
Joined Apr 2007
|
Status: HARD SHYT SCUBA TRADER
|20,883 Posts
ES can sometimes give some confusing signals .. they want that.
Are those charts from different days ?
with es those trigger lines are KEY , 1343 , 1330 , 1329, etc.
Also consider the higher time frame. I know Dr G and i were texting back and forth thursday saying wtf , but we stuck by our guns and got our reward on Friday.
both wednesday and thursday were no demands , so all we can assume was that the pros were drying up that demand at 1330. The fact that on prior moves 1330 up there was stopping volume and wed / thursday last week there was lack of effort to rise / no volume.
I think that overall your analysis is correct , and based on the weakness on the daily we should be looking for sells. ( I was all week and pulling 10 to 14 points a day). The ? bar is a test of sorts sos , BUT remember background was weakness and on effort to rise to the sellers stepped in
Please indulge me here a bit. I had a hard time seeing this today so I am trying to "walk" myself through it. If you have any insights please feel free to add them.
I am going to try and put down what I was thinking then and now so it might be a bit jumbled. Plus it's way past my bedtime.
Okay take a look at the first chart.
The place to begin is with the first No Demand.
A. No Demand: Not VSA, but rather Wyckoff Candle Volume: the real body is smallish signifying no momentum to the upside. The Selling Shadow is equal to the Buying...
Please indulge me here a bit. I had a hard time seeing this today so I am trying to "walk" myself through it. If you have any insights please feel free to add them.
I am going to try and put down what I was thinking then and now so it might be a bit jumbled. Plus it's way past my bedtime.
Okay take a look at the first chart.
The place to begin is with the first No Demand.
A. No Demand: Not VSA, but rather Wyckoff Candle Volume: the real body is smallish signifying no momentum to the upside. The Selling Shadow is equal to the Buying Shadow...
Ignored
Hi HG, I'm not following ES but I'll tell you what I see from your charts alone.
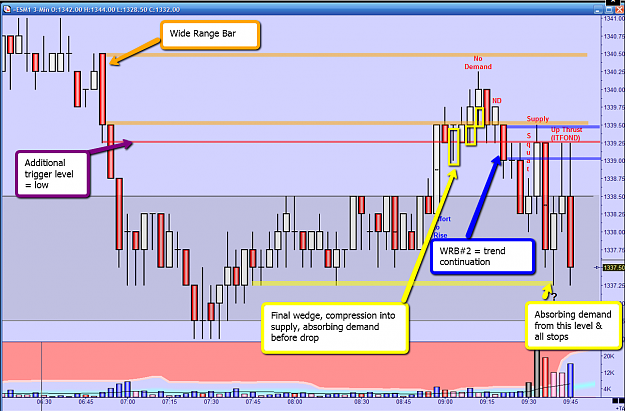
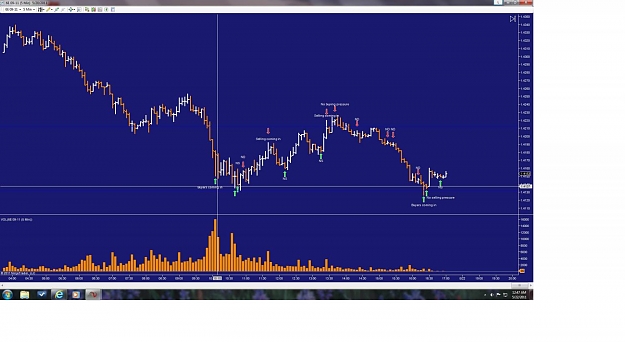
Your 'effort to rise' is a solid up bar on the highest volume for the past 37 periods and at first glance, looks strong but we should bare in mind that it is also a 'very high volume wide spread up bar'(we know that markets dont like these). What happens next is interesting for us. We see no follow through to the up side. We should now be thinking that the wide spread bar was indeed weakness not strength.
Then we get a good quality test....oh no perhaps it was strength after all! But we are saved by a ND. These 2 bars are indicating that SM have withdrawn after the wide spread up move to guage interest. Seeing none, they feel free to mark up price 1 last time (up bar on maybe 2nd highest volume in last 40 periods but spread only average) and still ND (spreads a bit wide really) comes next. The last few bars have indicated more weakness than strength to me.
BANG, bearish engulfing (engulfing the previous 2 up bars, 1 of which is a ND!) on increased volume. And, just incase we were still a bit unsure, SM paused to check for interest upwards and found none, ND. With the last few bars showing us weakness, I think a short is valid here.
The next few bars are very good for shorts, price falling with volume increasing steadily. Your bar marked 'Supply' may have stopped me at BE. If it hadn't, it would have concerned me because we can't be sure of how high it will take price. But when I see the volume, I would rest a little easier. Especially when I see the bearish engulfing next. An Ultra high volume up bar engulfed by a high volume down bar is great for us here. I dont care that the next bar is up, it is with lesser interest from SM. This bares out with the next up bar(Upthrust) on even lesser interest.
The bar marked 'Upthrust IFOND' is a test of demand(OK I know that Tom doesn't recognise a test of demand in VSA but it is still valid IMO). It is testing the 'hidden Gap' formed by the original high volume wide spread up bar. There is much less interest now than when price was last at that level. So price falls to form an UT(almost).
The next bar is down and very interesting for us. It is on increased volume, wide spread and engulfs both of the previous low volume up bars. This is now screaming short.
If we take a quick holistic look at the last 20 bars or so we see,
mark up, ND, bearish engulfing, ND, down bars on increasing volume, U high vol up bar closing off the high, bearish engulfing, low vol up bar, low vol test of demand, bearish engulfing on increased volume.
All of the above are signs of weakness and we should feel secure with our shorts until we see the 'Stopping Volume' bar. If I wasn't out already, I would be now.
Hope that helps some and hasn't confused you all too much!
this may take eu under 1.4. Looks like this may have been absorbing demand in the 4050 area , I sure got caught in the chop[ and did not have time to focus ... -240 pip on the week .... one of the most frustrating weeks ever. Most trades went +40 to +50 , missed tp by 10 pip before reversing and stopping me out
oh well overall month has been awesome
and as for es trades .. well lets just say I killed every effort to rise to 1343
I see a possible next stop to 1.4360-1.4450 before a next ANOTHER strong move. ...
If distribution gives way at 1.4050 , i see a possible move down to 1.39-1.36.
Can't wait to see what happens.
Ignored
Looks like last week to 1.4360-1.445 was a failure. 1.4050 and 1.4330 will be on my eyes. There seems to be more stopping volume to the upside (no demands) than to the down side (no supply). New market condition? Possibly.
Joined Sep 2010
|
Status: I'm not here... or am I?
|3,999 Posts
So I decided to make one last post on triggers to look at a question I have been asked a few times... "How long should I leave on trigger levels?"
Some intraday guys would answer with "take them off when a new higher volume trigger prints", some would say "take them off at the end of the day and start fresh"...
I start every Sunday by doing the following;
1. I manually draw on the High and Low's for the last 2 weeks.
2. I manually draw on the 4 highest 4hr volume triggers (for as far left as I can see on a zoomed out chart).
3. I manually draw on the 4 highest 1hr volume triggers (for as far left as I can see on a zoomed out chart).
4. I also use a pivot indicator which automatically draws on previous day H/L, daily open, DPV and daily S & R levels
Now this sets me up with previously important triggers which could well serve as re-tested entry points in the upcoming week and also the daily levels that I also use as triggers.
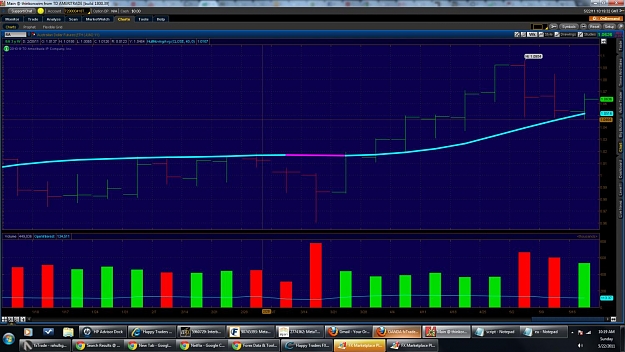
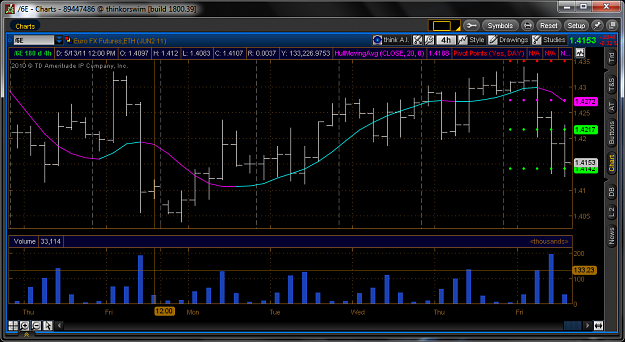
Now on a daily basis I will place my 5 and 15 min triggers and keep them on for the day. If a bar stands out like I had on Thursday (per my attached chart) I will leave them on for refernce during the next trading day. Why do I do this? Because the market is always testing I like to keep these "odd" bars in the back of my mind.
Now to the chart...
So I marked the bar from Thursday that stood out with Ultra High volume which was way higher than any other bar... I left the H/L and C of this bar on so if price re-entered this zone I could watch for entries.
Now LO started with a fake break out... or so it would seem. If you keep a close eye on swing high and swing lows (as well as the daily high and low close levels) then you would not see that squat into Thursday's high as a SOS and you wouldn't have gone in long... why? Look at the effort to rise I marked... look really close at the close. It closed at 4334 which was right on the current daily high from that Asia pin bar. So now we have some SOW with the effort to rise, followed by a selling bar and then a squat. Now the squat could be looked at as a SOS so we have some mixed signals... Stay out.
Right after the squat we have a No Buying Pressure bar... not a ND but a SOW as we headed back into the close of the Effort to Rise bar and close off the high. More sellers in the next bar and a hidden test into the Thursday high (closed below) and a test for demand into the Effort to Rise with none found. Enough weakness confirmed and a safe short entry.
Now you might be saying "I thought this post was going to be about old triggers from Thursday, why are you wasting my time?"... sorry
So now we have SOW and may of may not be short... we have started to head down towards that trigger zone from Thursday. I marked a Key bar which not only takes us into the trigger zone but also takes us below the DPV (good for shorts). Now this bar was the highest volume bar of the day and a wide spread bar. One might want to book some profits if they went short off that Hidden Test or at least move stops to BE in case we see stopping volume and a reversal from this trigger zone.
The next bar does look like buyers but is a ND... it does close above the trigger close but as you will see this wasn't buying as the high was never taken out and in fact this would have made a nice short entry. 2 bars after the ND we have another Key Bar which takes us below the Thursday Trigger zone and now we are really thinking shorts... we are approaching NY open so let's see what they do.
Now right before NYO we see what looks like some buying but as you will quickly see this is a trap. 1hr and 15mins after NYO we have made it back to the low side of the Thursday Trigger zone and closed a ND with the high right on the Low Trigger (to the pip).. coincedence? No Way! So this was a beautiful short entry as well.
We go down make a new daily low and bounce around 4150... We find some buyers and make a retrace up around 90 pips and what happens we stop right on the previous swing low close level (again to the pip). The Effort to Rise I marked closed right on 4219 which was the previous swing low close. We head back down with a couple of downbar showing us that we found some possible sellers and then 2 ND's. I probably would NOT have taken a short at this point because of the time of day being after London Close and Friday afternoon. As you can see one could have traded it back down to the daily low.
For anyone new to VSA and or Triggers take a blank chart and watch for your big swing H's and L's... most likely if you look left you will be able to see why price stopped where it did. Previous trigger level, supply or demand zone etc...
So when I sat down to write this post my only point was about keeping an eye on "odd' volume bars longer than just the day the happen. That didn't work out as there was just too much nice stuff on the chart not to comment on it all. I guess I need to go back to school and take some classes so I can learn how to better focus ...
Anyway I think I have just about wore out the whole trigger subject with my long winded posts so I shall take some time off and just quietly follow along.
Hi HG, I'm not following ES but I'll tell you what I see from your charts alone.
Your 'effort to rise' is a solid up bar on the highest volume for the past 37 periods and at first glance, looks strong but we should bare in mind that it is also a 'very high volume wide spread up bar'(we know that markets dont like these). What happens next is interesting for us. We see no follow through to the up side. We should now be thinking that the wide spread bar was indeed weakness not strength.
Then we get a good quality test....oh no perhaps it was strength...
Ignored
HE"S BACK
Wyckoff VSA: (1) Supply & Demand (2) Effort vs. Result (3) Cause & Effect
The last two posts has screen shots of Friday's price action. As for the the second post with the two shots, I showed two charts to clearify my anotations. I usually show closed zones as shaded grey or yellow. When a zone is open (valid for entry signals) it is shown with the lines.
So it looks as if the area being disscussed is mute because the zone is close but it is actually open at the time.
Thanks for the info. You know how I feel about multiple time frames. If the second best method I have ever seen can trade off of one time frame, then VSA, the best method should be able to as well. Otherwise it would not be better.
Wyckoff VSA: (1) Supply & Demand (2) Effort vs. Result (3) Cause & Effect
The last two posts has screen shots of Friday's price action. As for the the second post with the two shots, I showed two charts to clearify my anotations. I usually show closed zones as shaded grey or yellow. When a zone is open (valid for entry signals) it is shown with the lines.
So it looks as if the area being disscussed is mute because the zone is close but it is actually open at the time.
Thanks for the info. You know how I feel about multiple time frames. If the second best method I have ever seen can trade off of one time frame, then...
Ignored
HG, thanks for the great examples, and to Intel ( I had to read that multiple times as I am still learning to add VSA info to the bars themselves ). The most puzzling bars were IMHO your marked ? and the 2 longwicked upthrust-kind-of bars. But Intel has posted such a great analysis, I don`t have much more to say...
Thank you all !
===================================================
( INTEL Quote : )
The bar marked 'Upthrust IFOND' is a test of demand(OK I know that Tom doesn't recognise a test of demand in VSA but it is still valid IMO). It is testing the 'hidden Gap' formed by the original high volume wide spread up bar. There is much less interest now than when price was last at that level. So price falls to form an UT(almost).
====================================================
Joined Apr 2007
|
Status: HARD SHYT SCUBA TRADER
|20,883 Posts
yes but a 3 min chart will not show that move from 1340 to 1250... that is brewing....so why not consider all time frames in your trading ? i do. So even though vsa will work on one time frame , it is often best to consider at least a 30 min chart even when day trading a 3 min
On es I have been happy selling all week .. and doing very well while doing so , why ? cause i know that the big money is distributing / selling and getting a large position on the short side of the market.
Joined Apr 2007
|
Status: HARD SHYT SCUBA TRADER
|20,883 Posts
I thought the same on weekly eur , but then at end of this week am reconsidering as we saw a sqaut week on Ultrahigh volume.
If you look at where the 1st 2 weeks of the last ended on audusd , in the lows of the bar = sellers. Last week was a squat bar and also the volume was as high as the prior two week.
If that is in fact a shake out I do not think we have had true proof of the strength yet