Hello all:
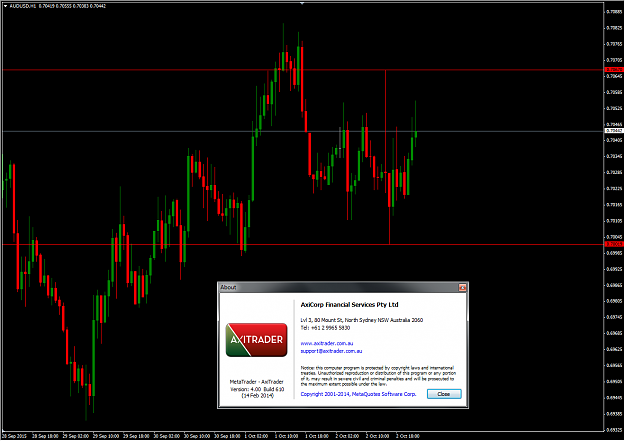
I am looking for a high and low indicator that puts a horizontal line on my chart. So if I happen to plot 231 1-hour candles, I want the indicator to put a line at the highest high and the lowest low. It also needs to display the price label.
Optionally, it would be terrific if the periods could be specified, as in: this is my 1 hour chart that I am plotting, and I want to know the highest high and lowest low of the last X periods, where X in the example above would be 231.
Why do I need this?
I currently do this by hovering the cursor over the presumed highest high and reading off the value at the bottom of the screen, which I then put into an Excel sheet for my trading system. I then do it for the lowest low and move on to the next chart, repeating this every 24 hours.
I have already looked at all the following indicators on ForexFactory here and unfortunately they over-complicate or don't meet this need:
###Daily-Weekly-Monthly Hi-Low; Support and Resistance (Barry); Yesterday High & Low v2.0; Super Signal v3d; i-Sessions; ShadowCandles_V2; Range_v2; #MTF_Support and Resistance (Barry); Trading Session vLines; SDX-ZoneBreakout2; Daily LinesBoxes; KiS_max_min_Avg_Monday Fixed; Pivots (SDX-TzPivots) 3; Pivots (SDX-TzPivots) 9 SR; Auto-Pivot Plotter (Mid-Levels) V1-41
Attached is a picture of what this indicator would look like.
Kind thanks!
Attached Image (click to enlarge)