Make Money Everyday.
How:
Capture as many moves as possible each day.
Framework:
Currency price action has natural support and resistance levels at each whole number, as well as each quarter level between whole numbers, AND the halfway point between each quarter level as well.
Some Things to Remember:
- The length of expected move is directly related to the length of time you are looking at. More often than not – Short timeframe = Small move and vica versa.
- Trading is not about being right or wrong, it is simply about being profitable or not.
- You are not your trades. Profitable trades do not make you better than you are and unprofitable trades do make you any less of a person. (I struggled with this for a long time).
- Time is time and Money is money. One is not dependent on the other.
- Price level is irrelavant to your trading. Your job is to trade price action, not to forcast whether something is too high or too low. When you have an opinion like that – you will miss trades.
- Your money is your inventory, so NO MONEY = NO BUSINESS. Love your inventory, use it prudently, and protect it with urgency.
- “No excuses, No explanations”, Tony Dungy. One of my favorite quotes. Take this however you like, I take it that if I have a problem, it's usually me.
- Risk can be predetermined, Reward is unpredicatable. I stole this from someone, but cannot remember where.... so my apologies if it's you.
- Market Orders are an easy way to go broke. I feel like when I am using Market orders, I am chasing the trade and I have not done a good job of planning my work. Use limit orders, stop orders, and OCO.
Nuts & Bolts:
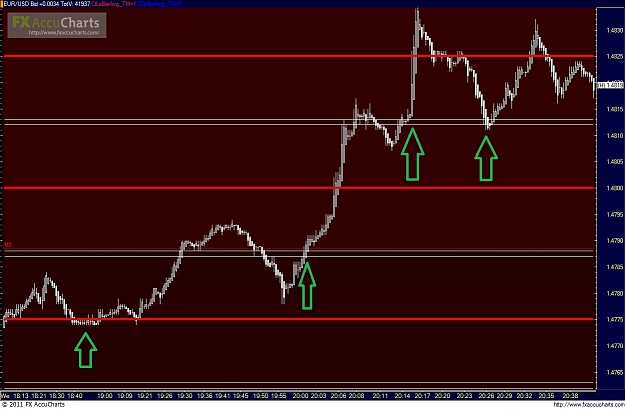
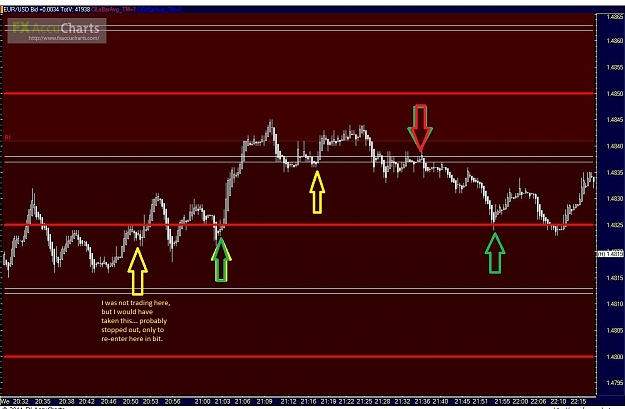
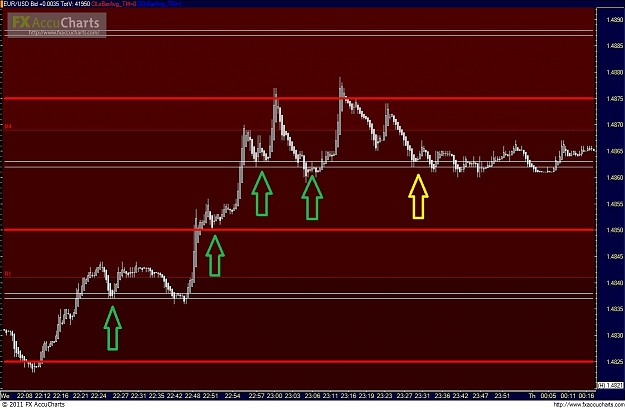
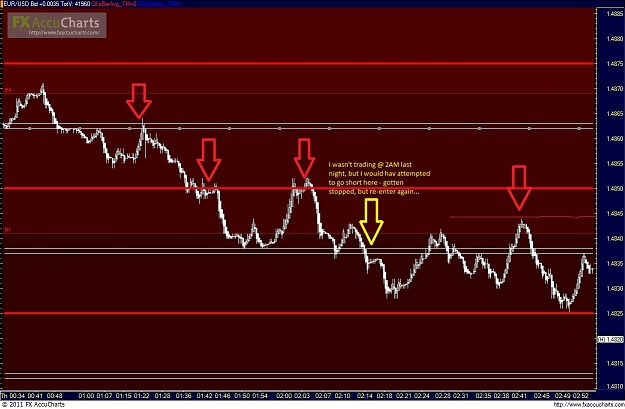
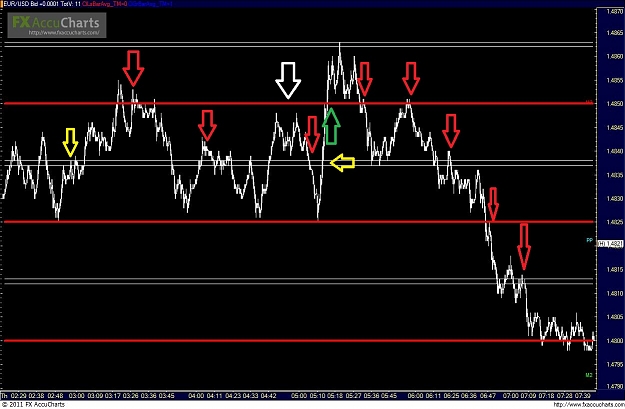
My goal is to capture as many 12 pip moves as my day will allow. My chart has price action, lines drawn at each .25 level, (xx.00, xx.25, xx.50, xx.75) lines drawn 12 pips away from each quarter level also (so xx.00 would then have a line drawn at xx.12 above it and xx.88 below it), plus I put on Pivot Points. I don't trade exclusively off Pivot Points, but enough people look at, and price action respects it, so I have it on there as reference.
I also start with an excel sheet with a dark line drawn through the middle, horizontally. I graph out the days moves, but with each 12 pip move. The 12 pip move has to start from a whole number, a quarter number or an 1/2 way (the xx.12, etc.). I start each day @ 5pm EST, and just block out on my graph paper each 12 pip move. Why? It helps me avoid getting caught up in the moment by moment movement of price action. I know that I'm looking for movement between two levels, this just helps me stay focused on that.
Now, everyone's 2 favorite questions – What time frame to use and which pairs? This is personal preference, but I use as small a time-frame as I can. Also, I use tick charts, instead of time charts, however 1M charts should suffice if you are unable to use tick charts. But if you can use tick charts - I use 10 tick bars. As far as pairs go, I believe again - personal preference. I trade EUR/JPY and EUR/USD primarily.
See attached excel file for the Examples and Master Copy of what my 'graph' paper looks like.
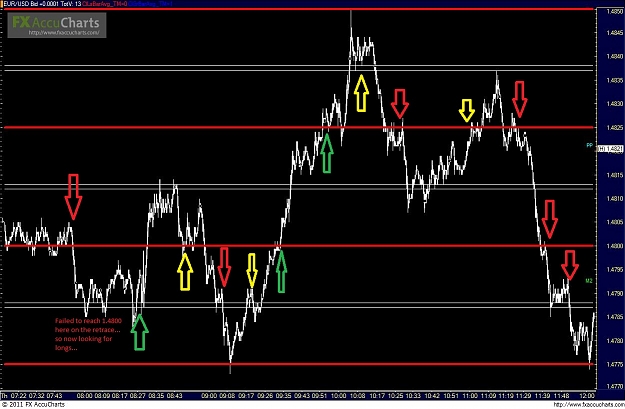
How do I use the graph paper? The first block is either +1/2 or – ½ off the middle horizontal line. It is always the first full 12 pip move between the quarter mark and the Eigth. (I have the 1/8th lines marked by double yellow lines on chart). Let's say for example, first move is up, so my first box filled in is the 1 box @ the +1/2 level. The next box I fill in will be a 2, and should it continue up, then I will box in the 2 @ the 1 level.
Now let's say it retraces – comes back down one 12 pip move, my next box would be still at @ the 1 level, but now in the 3 spot. It may be helpful to use different colors or symbols for up vs. down, I however just use a pencil and fill in the boxes as I go and I map out the day as it unfolds.
How does this help me? Well it keeps me going the same direction as the market. I know that if I am seeing a couple of + boxes strung together, I'm looking to buy. I also know that often times PA retraces, so I'm placing my orders to buy under the PA at the last 12 pip level, waiting to be filled. I continue doing this until it fails and the direction changes.
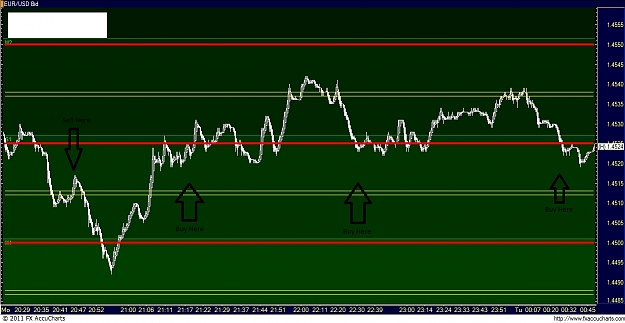
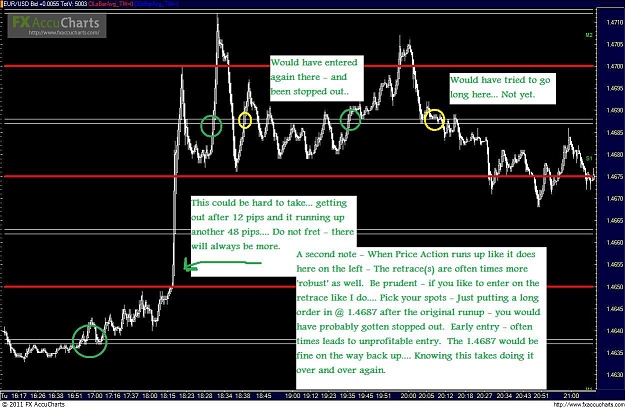
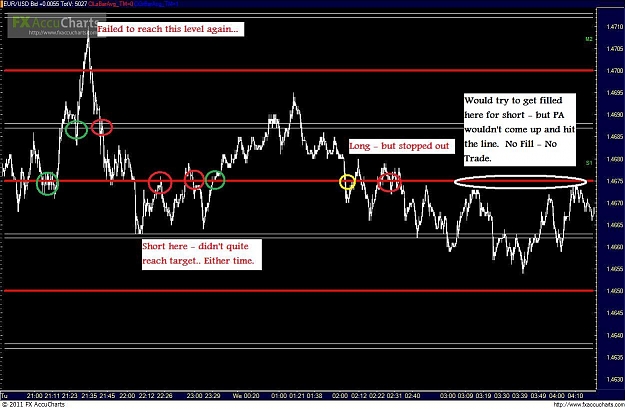
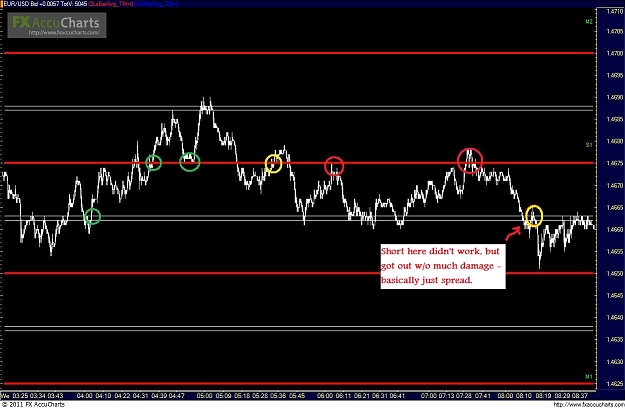
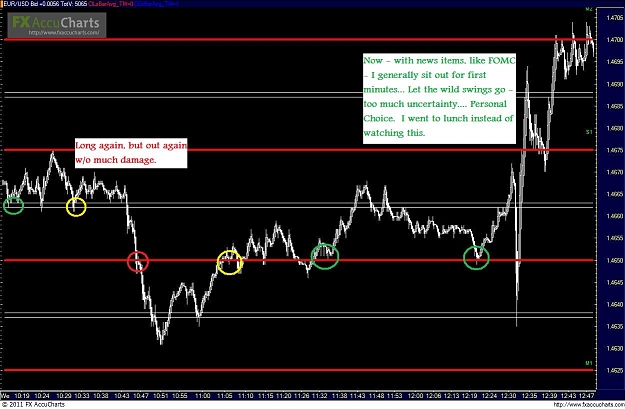
I have attached a chart, which may or may not help. It is from this evening's trading session. I'm pretty darn tired at this point, so I'll follow up with this more later.