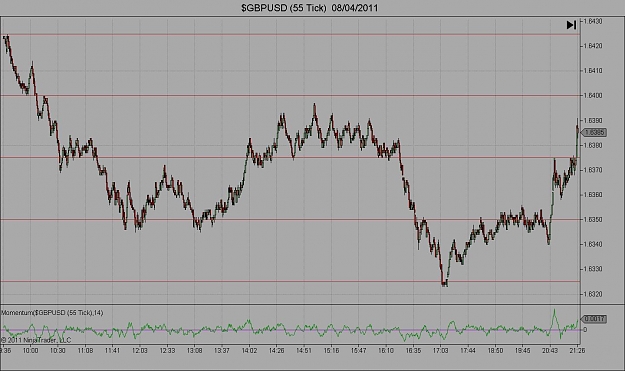
If anyone is interested or hasnt seen this before, below is a small increment tick chart of Fridays GU from 9:36 GMT to market close.
The red horizontal lines are the multiples of 25 in price and it seems these multiples in price feature heavily in peoples psychology as there are strong reactions when price reaches these lines probably hitting peoples limit orders/stops etc
That consolidation of price region between 14:00 GMT and 16:23 GMT was the result of a balance in buyers and sellers. Notice that the buyers and sellers tend to show up in waves, i.e. buyers come in and move price up 15 pips, then sellers come in and lower price 15 pips.
However at 16:00 GMT, it seems alot of buyers were losing confidence and stopped showing up this ofcourse meant sellers were able to push price down 60 pips to 6325, from there, it looks like a bunch of buy orders and profit taking took place as price quickly rebounded 15 pips to 6340 in the space of only a few minutes.
Whats bugs me though is there didnt seem to be anyway of seeing that 60 pip drop coming.
Attached Image (click to enlarge)
![Click to Enlarge
Name: 8)JV]@6O}`Z988X4L)Z(OEQ.jpg
Size: 125 KB](/attachment/image/677396/thumbnail?d=1365687715)