my mouth got me into trouble again, i need to post a chart now.
since vsa is difficult to explain/understand without an illustration
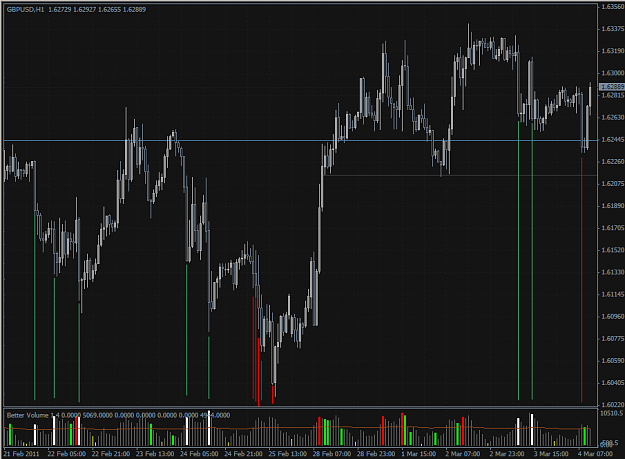
this is IBFX demo (hope the chart's clearly visible)
*green vertical lines show downbars with ultra high vol (white bars)
*red vertical lines show downbars with above average vol.
a very quick deduction on my part, is that these downbars are buying (strength).
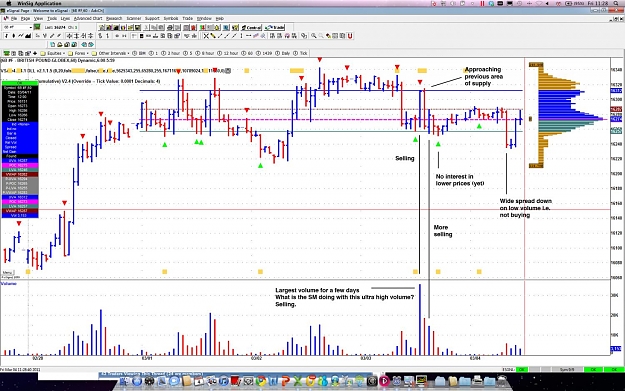
notice my chart spans several days more than yours (which is only upto Feb.28. i think u need to look further back (particularly in gbpusd's current scenario) to study the background.
also, u have to consider 2 things:
-Asian vol is minimal, so dont put too much weight on Asian vol./action
-we have NFP in a few hours... this might partially explain why volume is not 'substantial' as u noted
just my view
Attached Image (click to enlarge)