H! ALL.
Some notes about Breadth Indicators
[bad English, sorry ]
]
Financial Markets Observatory Lab.
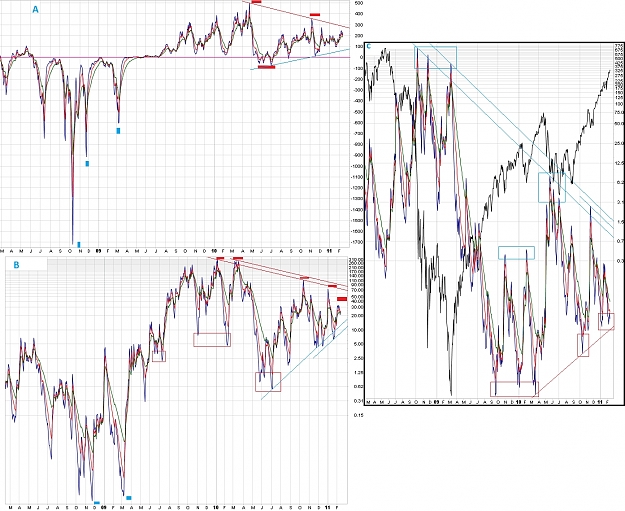
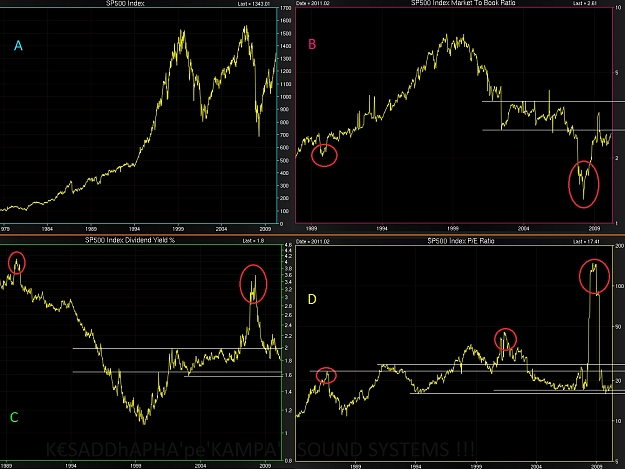
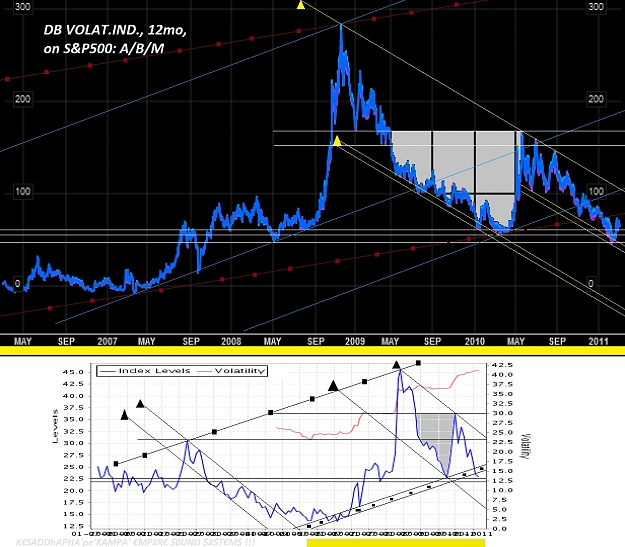
CHART A - daily ema-format 5/10/20 of spread New Highs vs. New Lows on NYSE (indicator in phase vs. US stocks-market).
Lows 2008/2009 shows an important anticipatory behaviour of this indicators.
Now the indicator is in hard divergence vs. US stocks-market on 2010/2011 tops (see descending red -line and -markers; negative sign, not a signal but a sign, for stocks-market in medium-term).
Now the indicator is inside a triangle-format (ascending blue vs. descending red lines; this last one is a positive sign, not a signal but a sign, for stocks-market in medium-short term).
Lows of 2010 is below 0-line and in hard divergence vs. previous 2010/2009-lows vs. US stocks-market, except, mar.2009 (negative sign, not a signal but a sign, for stocks-market in medium-long term).
CHART B - daily ema-format 5/10/20 of spread (ratio-format) New Highs vs. New Lows on NYSE (indicator in phase vs. US stocks-market).
Lows 2008/2009 shows an anticipatory behaviour of this indicators.
Now the indicator is in hard divergence vs. US stocks-market on 2010/2011 tops (see descending red-line and red-markers; negative sign, not a signal but a sign, for stocks-market in medium-term).
Now the indicator is inside a triangle-format (2-ascending blue vs. 2-descending red lines; this last one is a positive sign, not a signal but a sign, for stocks-market in medium-short term).
Lows of 2010 is in hard divergence vs. previous 2010/2009-lows vs. US stocks-market, except, mar.2009 (negative sign, not a signal but a sign, for stocks-market in medium-long term).
CHART C - daily ema-format 5/10/20 of spread (ratio-format) New Lows vs. New Highs on NYSE (indicator contrarian vs. US stocks-market).
Tops 2008/2009 shows a good anticipatory behaviour of this indicators.
Now the indicator-lows is in hard divergence vs. US stocks-market on 2009/2010/2011 tops (see ascending red -lines and squares; negative sign, not a signal but a sign, for stocks-market in medium-term).
Now the indicator is inside a triangle-format (2-descending blue vs. 2-ascending red lines; the first is a positive sign, not a signal but a sign, for stocks-market in medium-long term).
Tops of 2010 is in hard divergence vs. previous 2010/2009-lows vs. US stocks-market, except, mar.2009 (negative sign, not a signal but a sign, for stocks-market in medium-long term).
The double-bottoms of this indicator has a potential bearish impact vs. stocks-market.
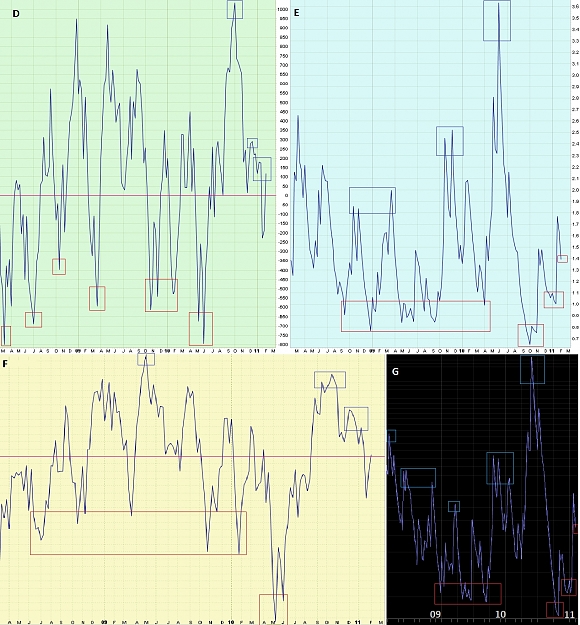
CHART D - weekly ema-format 10 of spread Advances vs. Declines Issues on NYSE (indicator in phase vs. US stocks-market).
Lows 2008/2009 shows an important anticipatory behaviour of this indicators.
Now the indicator is in hard divergence vs. US stocks-market on 2010/2011 tops (see blue-markers; negative sign, not a signal but a sign, for stocks-market in medium-term), as during 2009.
Now the indicator is above 0-line, a short-term positive sign for stocks-market.
Lows of 2010 is in-line vs. 2008 lows, in hard divergence vs. 3y-lows of US stocks-market (very negative sign, not a signal but a sign, for stocks-market in medium-long term).
CHART E - weekly ema-format 10 of spread (ratio-format) Declines vs. Advances Issues on NYSE (indicator contrarian vs. US stocks-market).
Lows 2009/2010 shows a good bullish trend for stocks-market on 3y-base.
Now the indicator-lows is in hard divergence vs. US stocks-market on 2010/2011 tops (see red-squares; negative sign, not a signal but a sign, for stocks-market in medium-term).
Tops of 2010 is also the 3y-top !!! in very hard divergence vs. 3y-lows of US stocks-market (strong negative sign, not a signal but a sign, for stocks-market in medium-long term).
CHART F - weekly ema-format 10 of spread Advances vs. Declines Volumes on NYSE (indicator in phase vs. US stocks-market).
Lows 2008/2009 shows an important anticipatory behaviour of this indicators.
Now the indicator is in hard divergence vs. US stocks-market on 2009/2010/2011 tops (see blue-markers; negative sign, not a signal but a sign, for stocks-market in medium-long term).
Now the indicator is in ascending-test of 0-line, a dangerous key-level for stocks-market.
Lows of 2010 is also the 3y-low !!! in very hard divergence vs. 3y-lows of US stocks-market (strong negative sign, not a signal but a sign, for stocks-market in medium-long term).
CHART G - weekly ema-format 10 of spread (ratio-format) Declines vs. Advances Volume on NYSE (indicator contrarian vs. US stocks-market).
Tops 2008/2009 shows an important anticipatory behaviour of this indicators.
Lows 2009/2010 shows a good bullish trend for stocks-market on 3y-base.
Now the indicator-lows is in hard divergence vs. US stocks-market on 2010/2011 tops (see red-squares; negative sign, not a signal but a sign, for stocks-market in medium-term).
Tops of 2010 is also the 3y-top !!! in very hard divergence vs. 3y-lows of US stocks-market (strong negative sign, not a signal but a sign, for stocks-market in medium-long term).
General comments
These indicators shows a decrease of market quality during 2010/2011 bull-legs, both from decrease of new tops in stocks (= increase of new lows in stocks) during bullish phases, and from increase of down-volumes and decline-issues, during bull-legs 2009/2010/2011.
The bullish break of the divergence lines, could be the signal of bullish final-leg, before a major corrective wave.
The hard 2010-lows are worrying (very worrying), according to these indicators.
Tuned on these breadth-technical indicators of the stocks-market, but follows short-medium term signs from prices, for a real-time and correct set-up.
It is very important do not anticipate the main trend of the underlying financial instruments.
K€SADDhAPHA'pe'KAMPA' SOUND SYSTEMS !!!
I.M.O. by $@!Ψ¥
Some notes about Breadth Indicators
[bad English, sorry
Financial Markets Observatory Lab.
CHART A - daily ema-format 5/10/20 of spread New Highs vs. New Lows on NYSE (indicator in phase vs. US stocks-market).
Lows 2008/2009 shows an important anticipatory behaviour of this indicators.
Now the indicator is in hard divergence vs. US stocks-market on 2010/2011 tops (see descending red -line and -markers; negative sign, not a signal but a sign, for stocks-market in medium-term).
Now the indicator is inside a triangle-format (ascending blue vs. descending red lines; this last one is a positive sign, not a signal but a sign, for stocks-market in medium-short term).
Lows of 2010 is below 0-line and in hard divergence vs. previous 2010/2009-lows vs. US stocks-market, except, mar.2009 (negative sign, not a signal but a sign, for stocks-market in medium-long term).
CHART B - daily ema-format 5/10/20 of spread (ratio-format) New Highs vs. New Lows on NYSE (indicator in phase vs. US stocks-market).
Lows 2008/2009 shows an anticipatory behaviour of this indicators.
Now the indicator is in hard divergence vs. US stocks-market on 2010/2011 tops (see descending red-line and red-markers; negative sign, not a signal but a sign, for stocks-market in medium-term).
Now the indicator is inside a triangle-format (2-ascending blue vs. 2-descending red lines; this last one is a positive sign, not a signal but a sign, for stocks-market in medium-short term).
Lows of 2010 is in hard divergence vs. previous 2010/2009-lows vs. US stocks-market, except, mar.2009 (negative sign, not a signal but a sign, for stocks-market in medium-long term).
CHART C - daily ema-format 5/10/20 of spread (ratio-format) New Lows vs. New Highs on NYSE (indicator contrarian vs. US stocks-market).
Tops 2008/2009 shows a good anticipatory behaviour of this indicators.
Now the indicator-lows is in hard divergence vs. US stocks-market on 2009/2010/2011 tops (see ascending red -lines and squares; negative sign, not a signal but a sign, for stocks-market in medium-term).
Now the indicator is inside a triangle-format (2-descending blue vs. 2-ascending red lines; the first is a positive sign, not a signal but a sign, for stocks-market in medium-long term).
Tops of 2010 is in hard divergence vs. previous 2010/2009-lows vs. US stocks-market, except, mar.2009 (negative sign, not a signal but a sign, for stocks-market in medium-long term).
The double-bottoms of this indicator has a potential bearish impact vs. stocks-market.
CHART D - weekly ema-format 10 of spread Advances vs. Declines Issues on NYSE (indicator in phase vs. US stocks-market).
Lows 2008/2009 shows an important anticipatory behaviour of this indicators.
Now the indicator is in hard divergence vs. US stocks-market on 2010/2011 tops (see blue-markers; negative sign, not a signal but a sign, for stocks-market in medium-term), as during 2009.
Now the indicator is above 0-line, a short-term positive sign for stocks-market.
Lows of 2010 is in-line vs. 2008 lows, in hard divergence vs. 3y-lows of US stocks-market (very negative sign, not a signal but a sign, for stocks-market in medium-long term).
CHART E - weekly ema-format 10 of spread (ratio-format) Declines vs. Advances Issues on NYSE (indicator contrarian vs. US stocks-market).
Lows 2009/2010 shows a good bullish trend for stocks-market on 3y-base.
Now the indicator-lows is in hard divergence vs. US stocks-market on 2010/2011 tops (see red-squares; negative sign, not a signal but a sign, for stocks-market in medium-term).
Tops of 2010 is also the 3y-top !!! in very hard divergence vs. 3y-lows of US stocks-market (strong negative sign, not a signal but a sign, for stocks-market in medium-long term).
CHART F - weekly ema-format 10 of spread Advances vs. Declines Volumes on NYSE (indicator in phase vs. US stocks-market).
Lows 2008/2009 shows an important anticipatory behaviour of this indicators.
Now the indicator is in hard divergence vs. US stocks-market on 2009/2010/2011 tops (see blue-markers; negative sign, not a signal but a sign, for stocks-market in medium-long term).
Now the indicator is in ascending-test of 0-line, a dangerous key-level for stocks-market.
Lows of 2010 is also the 3y-low !!! in very hard divergence vs. 3y-lows of US stocks-market (strong negative sign, not a signal but a sign, for stocks-market in medium-long term).
CHART G - weekly ema-format 10 of spread (ratio-format) Declines vs. Advances Volume on NYSE (indicator contrarian vs. US stocks-market).
Tops 2008/2009 shows an important anticipatory behaviour of this indicators.
Lows 2009/2010 shows a good bullish trend for stocks-market on 3y-base.
Now the indicator-lows is in hard divergence vs. US stocks-market on 2010/2011 tops (see red-squares; negative sign, not a signal but a sign, for stocks-market in medium-term).
Tops of 2010 is also the 3y-top !!! in very hard divergence vs. 3y-lows of US stocks-market (strong negative sign, not a signal but a sign, for stocks-market in medium-long term).
General comments
These indicators shows a decrease of market quality during 2010/2011 bull-legs, both from decrease of new tops in stocks (= increase of new lows in stocks) during bullish phases, and from increase of down-volumes and decline-issues, during bull-legs 2009/2010/2011.
The bullish break of the divergence lines, could be the signal of bullish final-leg, before a major corrective wave.
The hard 2010-lows are worrying (very worrying), according to these indicators.
Tuned on these breadth-technical indicators of the stocks-market, but follows short-medium term signs from prices, for a real-time and correct set-up.
It is very important do not anticipate the main trend of the underlying financial instruments.
K€SADDhAPHA'pe'KAMPA' SOUND SYSTEMS !!!
I.M.O. by $@!Ψ¥
Attached Image(s) (click to enlarge)