I think gu is showing strength... not weakness here..
Ignored
London close in 15mins... probably not too much left today. We did hit that 6080 level I mentioned earlier but haven't seen any tradeable reation as of yet.
London close in 15mins... probably not too much left today. We did hit that 6080 level I mentioned earlier but haven't seen any tradeable reation as of yet.
Ignored
15min NS just printed with high at 6077... Will GU drift up further to end the day?
No trades taken at all today... came into the charts at all the wrong times... oh well a new week and more trades come Monday (well Sunday Evening).
I think VSA is enough and it takes time to master it, one of Tom`s students said that it took 3 years and Gavin has known Tom 7-8 years and has sometimes losing trades, but to add something to VSA, I think Sam Seiden`s supply and demand-stuff is good, very good, and that takes too sometime to learn.
And with that trade what you took, price went sideways after that drop (and usually it will test low or atleast lower than that first NS, so I think you were too early), so that usually is not good sign and you could close that with small loss or small...
Ignored
Hi Juhanimi,
Which entry you mean ?
I just have 1 Long on EUR/USD at 1.3589, still have it for now.
If you mean this one, yeah I agree it was too early as I mentioned be careful in Asian session, just happen to be around PC to trade at that time.
Totally agreed with you on Sam Seiden. Get their free newsletter, very cool and simple stuff esp from Sam.
It would be good to be able to see so fast how he sees it, just need more patience with his style of trading, very few trades he do.
I am starting to look more for those Support and Resistance lines, what Sam does is like to do with the unfair value that mentioned within AMT.
Sam just sees it faster, and just wait and wait and wait for price to come to him. Then he pounced on the entry automatically without being at the PC.
Joined Oct 2008
|
Status: Just be the witness.
|1,089 Posts
As a silent reader of this thread I wanted to say thank you especially to foxybunny for his charts, they are extremely informative and make learning much easier for me.
As far as Sam Seiden`s supply and demand approach, redsword11 in his " Price is everything " thread demonstrates this kind of trading very well - although too fast for me. But going through his charts again and again has helped me to see how Sam`s ideas are tradeable.
Thank you to all, please continue, and have a good weekend.
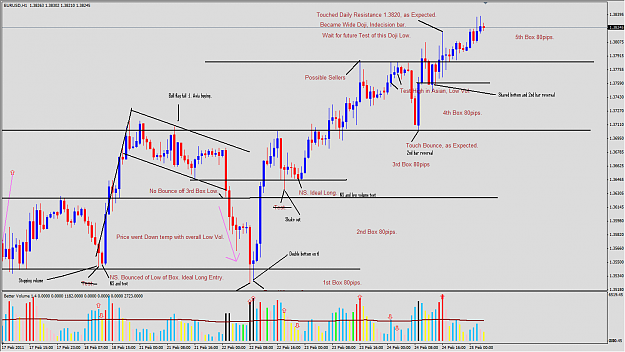
I hope you don't mind that I made some amendments to your chart. This is hourly as I read it.
Ignored
Hi 1pipperhour,
I don't mind you putting your thoughts on my chart. Thanks for your comments
At least someone is reading!!
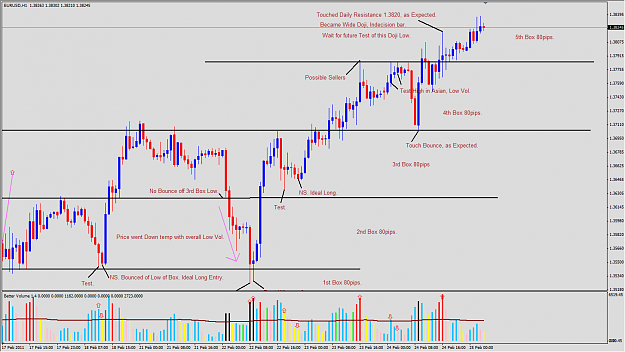
I included the 24-Feb EUR/USD H1 Charts of my original analysis and your amendments to compare and discuss.
Looking from left to right.
My viewpoints:
- Basically I put it as a "Test" when it touches one of the Support/Resistance on the Box line drawn.
Because it really is testing that S/R.
- Where you put "Stop Vol", I may not agree coz Vol not significant in that area to be "Stop Vol".
- You marked a bar as both "NS and Test".
It cannot be both in this scenario, as a Test Low will have a long tail testing the low, then its Close must end near the Top.
Whereas your NS is a full bar and Close near the Bottom, this is Not a Test.
- Bull Flag. I don't categorise this pattern much, unless they occur in shorter time frame like M5 or M15.
And only classifly them as "Flag" if they are tight like few candles in the flag.
Your bull flag has too many candles in the flag.
I would expect like 5-10 candles in a flag based on M15 or M5. On H1, I also expect about the same as well.
- Yeah the "Bull Flag failed" because it was NOT a Bull Flag.
Just look at the simple Box Lines and how prices Test those Box High and Box Low.
Also you can see that as price moving up in this "Bull Flag", Vol overall declining, and expect to fall.
Note that day was Public Holiday, then next day news events helped to move it down to the Box Low.
- The "Shake Out" you wrote down, and I wrote down "Test".
"Test" because it is testing 3rd Box Low.
It is Not a "ShakeOut" for me because there are too many bars to the immediate left of this bar, and this was Not in a real "Swing Low area".
If there is no immediate bars on the left, eg. Swing Low or better is near bottom of DownTrend, then I may consider it as a "ShakeOut".
It is better for you to view both my H1 and M15 charts to analyse, as I put a little bit of different analysis on the M15 compared to H1.
Also if you have not, refer to my last few posts from earlier on EUR/USD since 16-Feb to see clearer overall pictures of how EUR/USD moving in a "nice orderly manner" so far.
Waiting for the big wipeout now on EUR/USD, just need to exit first!!
Joined Apr 2007
|
Status: HARD SHYT SCUBA TRADER
|20,883 Posts
agree ... seems to be buyers sitting right in that 1,37xx area
which makes for an awesome long into 1.4 area next week as oil takes off again ( stopping volume yesterday followed by testing on 60 min today.. same pattern as last time at 105 to 98 area)
Once again this week ... macd trader 0 - scuab traders 1 . That makes game score so far macd trader 0 scuba traders 2.
Got into heated debate on why the asia shake out Monday was low of week. The weekly range fell short by 10 PIPS only , 310 pip
On this note and to end the week off with a bang I had to sell this stochastic cross down for a whole 8 pips OMG .. I am off to buy my yacht ..lol
agree ... seems to be buyers sitting right in that 1,37xx area
which makes for an awesome long into 1.4 area next week as oil takes off again ( stopping volume yesterday followed by testing on 60 min today.. same pattern as last time at 105 to 98 area)
agree ... seems to be buyers sitting right in that 1,37xx area
which makes for an awesome long into 1.4 area next week as oil takes off again ( stopping volume yesterday followed by testing on 60 min today.. same pattern as last time at 105 to 98 area)
Once again this week ... macd trader...
Ignored
No trades taken today so I have been somewhat bored... Thought I would try and embarrass myself by throwing together another Malcombesque week long prediction for next week. I think Monday we see a move down and shake out in the 3640 area (yes that same old 3640) forming the base for the week. Move up from there to close out the day back around the next point of interest at 3770-3780. Take out that old 3860 high on Tuesday or Wednesday and by then end of week we will have formed a new swing high at 3940-3970. I don't think we will take out 1.4 until the second week of March but hey next week may do it if we get some crazy volatility Thursday or Friday since it is (Malc close your eyes)... NFP week.
No trades taken today so I have been somewhat bored... Thought I would try and embarrass myself by throwing together another Malcombesque week long prediction for next week. I think Monday we see a move down and shake out in the 3640 area (yes that same old 3640) forming the base for the week. Move up from there to close out the day back around the next point of interest at 3770-3780. Take out that old 3860 high on Tuesday or Wednesday and by then end of week we will have formed a new swing high at 3940-3970. I don't think we will take out 1.4 until...
No trades taken today so I have been somewhat bored... Thought I would try and embarrass myself by throwing together another Malcombesque week long prediction for next week. I think Monday we see a move down and shake out in the 3640 area (yes that same old 3640) forming the base for the week. Move up from there to close out the day back around the next point of interest at 3770-3780. Take out that old 3860 high on Tuesday or Wednesday and by then end of week we will have formed a new swing high at 3940-3970. I don't think we will take out 1.4 until...
Joined Apr 2007
|
Status: HARD SHYT SCUBA TRADER
|20,883 Posts
so my nfp prediction is +1.5 million jobs created.
this is how
All unemployed bums that go to unemployment office to pick up cheques will be conned into signing up for an all expenses paid vacation to deal with their depression. The unemployment office will explain that it is a new Obama mandate as he is such a nice guy.
Upon arrival at the airport they will be gassed with DR G's special knock out mustard gas , the unconscious bodies will be loaded onto military transport for transposrt to the wonderful holiday destimation of LIBYA
Upon awaking at thier tropical desitnation they will provided , by the CIA , with weapons and uniforms with the enscription GUN FOR HIRE on the back of the uniforms.
Of course when they are hired the contrcat is directly with the US government.
Awesome Obama administration move
1) new jobs create 1,5 million
2) Unemployment claims will drops to none
2) Long term unemployment claims will also drop if 1 million of the vacationers die in war
Joined Apr 2007
|
Status: HARD SHYT SCUBA TRADER
|20,883 Posts
looking at my 12 hour scuba charts i see that todays DOWN bar is the lowest Friday volume since dec 10th at 1,3200. That bar gave a 300 pip range up week the following week
I included the 24-Feb EUR/USD H1 Charts of my original analysis and your amendments to compare and discuss.
Looking from left to right.
My viewpoints:
- Basically I put it as a "Test" when it touches one of the Support/Resistance on the Box line drawn.
Because it really is testing that S/R.
- Where you put "Stop Vol", I may not agree coz Vol not significant in that area to be "Stop Vol".
You marked a bar as both "NS and Test".
It cannot be both in this scenario, as a Test Low will have a long tail testing the low, then its Close...
Ignored
Well this is how I understand it. Maybe I'm wrong then. Volume is significantly higher than on prevoius bars. After that stopping volume bar next bar moved back to that area one more time but with lesser volume, so testing supply (don't really care how the candle looks on specific tf). Test was succesful.
- Bull Flag. I don't categorise this pattern much, unless they occur in shorter time frame like M5 or M15.
And only classifly them as "Flag" if they are tight like few candles in the flag.
Your bull flag has too many candles in the flag.
I would expect like 5-10 candles in a flag based on M15 or M5. On H1, I also expect about the same as well.
- Yeah the "Bull Flag failed" because it was NOT a Bull Flag.
Just look at the simple Box Lines and how prices Test those Box High and Box Low.
Also you can see that as price moving up in this "Bull...
Ignored
Actually it doesn't matter. Bull flag is not VSA but it gives something to my analyses so I still mark them. I don't think it failed because it was not a bull flag . It failed because Asia wanted better prices (that's what I think). I didn't really know that there is specific amount of bars in bull flag. This is hourly. On H2 there are less candles. H4 even lesser . Maybe H4 meets your criteria then
- The "Shake Out" you wrote down, and I wrote down "Test".
"Test" because it is testing 3rd Box Low.
It is Not a "ShakeOut" for me because there are too many bars to the immediate left of this bar, and this was Not in a real "Swing Low area".
If there is no immediate bars on the left, eg. Swing Low or better is near bottom of DownTrend, then I may consider it as a "ShakeOut".
Ignored
As I see it, it is SO. Don't really care about swing high or low . It looks like a shake out, maybe catching somebody's stop losses. I don't know. There is also enough volume to be considered a normal shake out. I don't see it testing anything (maybe it is). Test is followed where you wrote "ideal long". That low volume down bar tested the area where previously was supply. Low volume-no supply (succesful test) and up we go.
It is a little bit hard for me to follow multiple charts and explanations in one post. But hey, that's just me. Keep posting. I like your posts.