i'd assume you'd attached the basket profit 2 pairs indi, are you using it together with sq's ea? and where did the trend line came from?
adios...
Ignored
The indi is SQ's latest update. If you look back on his latest posts you will find it. No i'm not using SQ's ea.. yet. I use Steve Hopwood's multi purpose trade manager "MPTM" for basket trades. Search for it if you want to know more.
I drew the trendline manually to illustrate a point.
Yes, i use jones indicator to see corelations. I use SQ's EA for auto trading. Testing in hourly and 5 min. Both have resulted good profits.At times DD was max about 120 pips. Can live with it.
I use SQ's basket profit indi for manual trading. If used correctly, DD could be much lower by using this indi.
I use Mataf site to see daily volatility in order to avoid high volatile pairs.
Ignored
HOW TO USE daily volatility (MATAF) IN THIS STRETAGY ?
|
Joined Feb 2011
|
Status: Junior Member
|7 Posts
hi, i had read it thru all de page finally... i attach de latest ea stot2, on my chart, but it seem not working.. i hv no idea.... anyone can help to put a template with the ea again?? thanks for helping...
I am wondering why the numbers in the chart showing differently with the appearance of the yellow lines,and with those in the Table of"Tradable Corr" too?
GC/GU: Text 46%. Yellow line: 80% approx. While in Table of "Tradable correlation 1.8": 19%
EC/EU: Text 47%. Yellow line: 75% approx. While in Table of "Tradable correlation1.8": 20%
HOW TO USE daily volatility (MATAF) IN THIS STRETAGY ?
Ignored
If you look at mataf link which i posted, it will give you volatility of various pairs for the current week or past weeks. GBPCHF,GBPJPY,GBPCAD have high volatility means big movements compared to other currency pairs.
If the volatility of certain pairs are high, when you trade in this strategy, whenever the trades are going opposite, we will come across big DD. To avoid big DD, i do not use these pairs.
Ignored
if we avoid these pairs then we are not getting much signal most of the baskets are belongs to these pairs.anyways how many past weeks you check ?
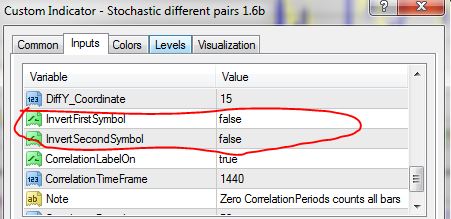
If I trading on positive correlation pairs (EU/GU). The default setting for InvertFirstSymbol and InvertSecondSymbol in "Stochastic different pairs 1.6b" indicator should be set to false? Am I right?
Hi Nicastro, I tried the News indi found here but it required some DLL file. I do not have the DLL file name as I am not at my home computer but that was the reasone why it did not work for me. If you happen to have that DLL please post here.
Ignored
Hi, there is an FFCal indicator on the site.
Among my system I found a version of it by Scoobs which is probably better than the basic version.
Yes Roundrock, trading correlated pairs like this shows better potential, but that would be on higher timeframes / longer term.
So I coded the SMA and StdDev lines into the Basket Profit indicator, to see if that would give an edge.
It plots the SMA(100) line on top of the Profit Basket line, and calcs the stddev of the Profit-line-to-SMA difference.
Similar as Bollinger Bands, except that we don't use the same amount of periods for the SMA and the StdDev:
we want a short-term SMA to stay close enough to the price line, but we want to use the...
Ignored
about basketprofit2pairs how to decide on which curriences to go buy and sell ?
Yes Roundrock, trading correlated pairs like this shows better potential, but that would be on higher timeframes / longer term.
So I coded the SMA and StdDev lines into the Basket Profit indicator, to see if that would give an edge.
It plots the SMA(100) line on top of the Profit Basket line, and calcs the stddev of the Profit-line-to-SMA difference.
Similar as Bollinger Bands, except that we don't use the same amount of periods for the SMA and the StdDev:
we want a short-term SMA to stay close enough to the price line, but we want to use the...
Ignored
Hi,
can you please tell me the entry ,exit and sl criteria for this indi ?
Many thanks DL/others to bring the concept of correlation into light...I was always curious how this concept can be traded in the forex market.
So let me see if I got the picture right...pls correct me if I am wrong!
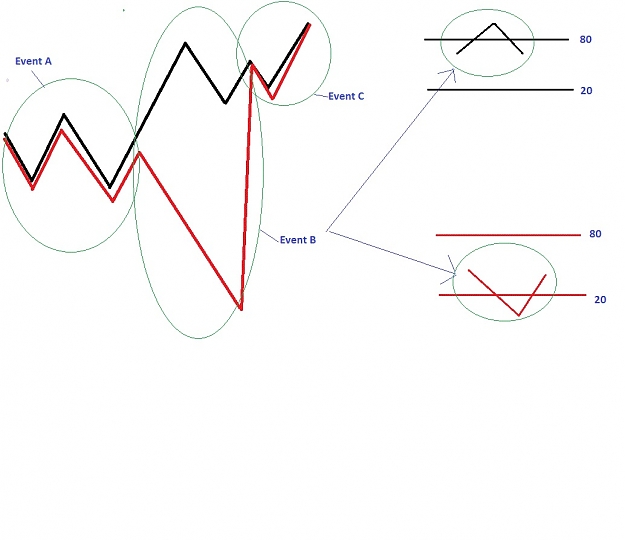
Attached picture is the conceptual idea of trading a positive correlation:
pair A in black pair B in red
Event A: Both pairs moving in the same direction along with their stoch...
Event B: Pair B moves away from Pair A, stochA -> overbought > 80
stochB -> oversold < 20
Event C: Pair B resumes correlating with pair A along with their stoch...
During Event B: Sell pair A & Buy pair B when stoch diff >60 (80-20)
as I researched, the William's is similar to Stochastic. So -I assume, you have some experience with it- what is the difference especially advantage ref to the Stocastic to use it?
It's resonable not to execute correlation trades before news. But if you are in a or some trades, you can't prevent news release over time of open trades. I remember some members having trades continuing over 1-2 days.
Until now I didn't check this closely - but am interested in experiences of managing such trades, if news are released in affected pairs.
i think williams is a bit better then stoch incase we get a big news event that will add your buy and sell to soon. so you end in a largde drawdown for a long period of time.
therefor i would like to see what would happen if we add williams code for the smjones indicator instead of stoch.
since i cant code, i like someone to change stoch code for williams code and see how it looks like.
if williams looks better then stoch, then why not use that 1 in Ea compared to stoch?
also Josh your right about news event. they are a blessing or a curse. so they could give you good profit or huge drawdown.
when having a huge drawdown i used hedging/scalping to get me rid of the huge drawdown.
this is possible to do when your in a ranging period. just look at the price of the correlation pairs that have your drawdown. check if there is no huge news event coming up for some time. then your save to trade. i use this idea on 5 minute chart. and only do this for 1 hour to scalp. whatever profit you made in that 1 hour , for me it was anything between 15 and 60 pips. i did this until my trade was breakeven then i closed both correlation pairs. went from -120 pips to breakeven. so far i have not lost any correlation trades, because of this scalping hedging idea.
if this is possible to add in an EA then your done. so whenever for example drawdonw reaches -100. then Ea should activate hedging/ scalping on timeframe you want. after trade of correlation reaches breakeven. then close all trades.
i think williams is a bit better then stoch incase we get a big news event that will add your buy and sell to soon. so you end in a largde drawdown for a long period of time.
therefor i would like to see what would happen if we add williams code for the smjones indicator instead of stoch.
since i cant code, i like someone to change stoch code for williams code and see how it looks like.
if williams looks better then stoch, then why not use that 1 in Ea compared to stoch?
Ignored
William's and Stochastic are exactly the same, just shifted in range (-100..0 for W, 0..100 for Stoch).
Plot a Stochastic(21,1,1) on top of your William's(21) and you'll see they overlap exactly.
This is confirmed by their formulas (go to ml4 codebase to have the math details).