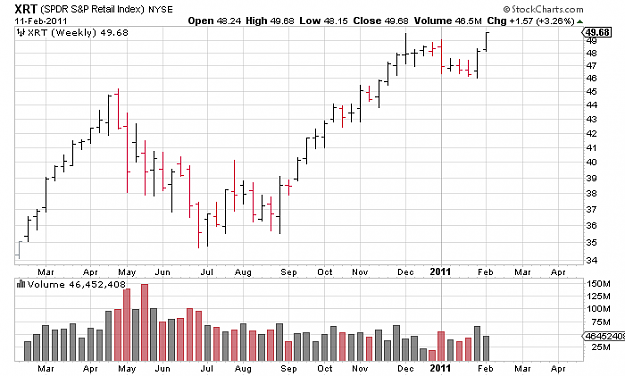
Well charts were developed in the late 70's which allowed traders,market specialists and firms to see the development of orderflows and market paticipation in realtime.Fast forward to 2011 and charts are categorized in my terms as a map for the market.As a trader you need to be able to see where your going or whats going on with thte insiders and the market from a birds eye view
- Post #1,468
- Quote
- Feb 13, 2011 5:09am Feb 13, 2011 5:09am
- Joined Jun 2009 | Status: Member | 7,795 Posts
- Post #1,480
- Quote
- Edited 2:43pm Feb 14, 2011 2:13pm | Edited 2:43pm
- Joined Dec 2008 | Status: Resident Psychiatrist!!! | 2,600 Posts