It s always about probabilities not certainties.
Let's look at the hourly EURUSD chart that we have been following.
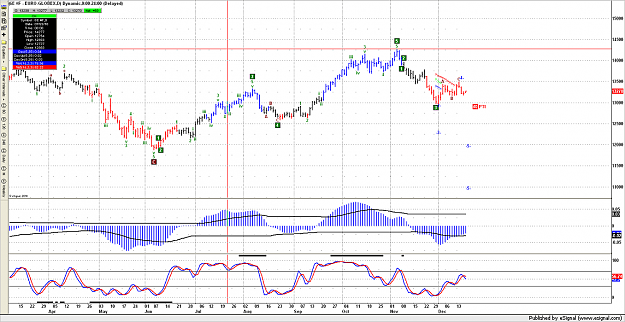
First of all the hourly big picture:
Our count may change a bit as the software deals with the wave four. It is always interesting to see the possibilities that the wave count presents but we want to trade as well. Using a breakout past the fractals works well as always.
Remember, if the count is confusing you are probably in a wave four of some degree.
http://www.elkvalleygold.com/Forex/F...0Nov2%20H1.jpg
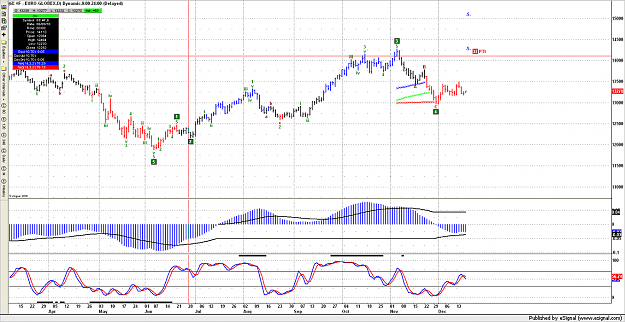
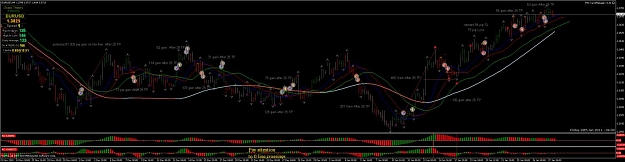
Now the detail as we zoom in on the hourly chart:
There are some nice fractal breakouts here that I have been using to advantage. However, I do not want to get into the minute by minute waves and torture myself. ELWave is extremely good at pulling order out of the chaos of lower time frames. My thinking is why bother?
If I set out to paint my house I select a big paint brush not an tiny artist's paint brush. if the object of trading is to make money, then go for the easy money and the big money. Don't get trapped into a fascination with the minute by minute stuff.
You can paint a house with an artist's brush but that is insane. Maybe you can trade one minute charts but try using a bigger brush for bigger results. I can be an EW artist but I have been there and done that in OEX options and it makes you are a slave to your computer.
H1 (hourly) is as far as care to delve in to EW structure. I have been doing so here because I am trying to explain how I use the ELWave software, but daily is where it is at for me. I like the big brush for a big job.
Let's look at the Bill Williams approach on a daily chart after the detail is observed.
http://www.elkvalleygold.com/Forex/F...1%20detail.jpg
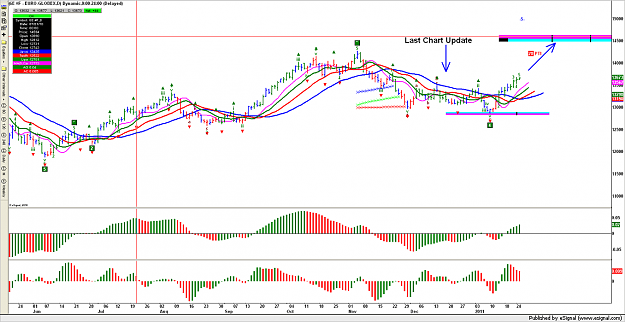
The Daily chart using the classical Bill Williams indicators:
How many 1 hour trades are there in this chart?
You have seen how I have used the H1 to get inside the daily waves and may even have played some of the H1 trades.
I use HI to verify where I am in the daily chart, I may even go smaller to verify the correct H1 count but ultimately I want to stay away from trading in the lower time frame.
Here is why:
I don't want to have to check my computer every hour or even every four hours to monitor my trades. I certainly don't want to check it every 5 minutes... though there are ways to get around that with some new trailing stop software I have been testing.
(Check the http://www.forexfactory.com/showthread.php?t=218567 thread on Forex factory.)
What I like to do is only have to check once a day.
Here are three trades that are all BW strategy. Together they took about three months and involved runs that totaled a bit over $25000 using one contract. Can you find enough trades that run $25000, trading one lot per time, in a 5 minute chart in those three months? Maybe. I don't care to make that much effort and tie myself to a terminal for all the hours required.
I eyeball the MT4 chart for the possible wave count and then run the same data through ElWave. When the EW counts match and my thinking is confirmed, then I watch the fractal that at will trigger a trade.
It is not very exciting. It requires patience. Acton junkies need not apply.
As you can see the AC has three green bars, The AO has turned green, there is a fractal waiting above the red alligaor line. The eyeball count suggest a fifth wave may occur if that fractal is taken out .
http://www.elkvalleygold.com/Forex/F...202%202010.gif
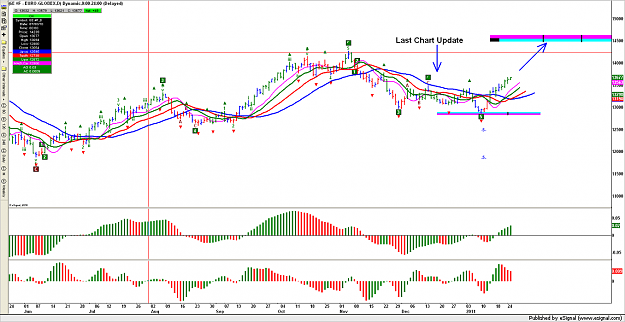
The last chart is the matching ElWave count. It is one of several counts that all end in the same pattern we are following. I selected it as it fits with the AO. Remember that it is compressed.
Fit it all together; Bill Williams, ELWave; the indicators the fractals and I have a buy stop in above that fractal. Its all about probabilities and that is as good as I can make it.
A special note. I am using data from IAMFX. Your broker data may look a bit different. I am also scaling my ElWave charts in linear format. I am not using semi-log scaling as MT4 does not offer that and I am trying keep confusion to a minimum. ELWave charts are compressed to make them fit on to the screen so they will look different from MT 4 charts
I appreciate the PMS that I have been getting and hope I have answered all the questions here. I also have decided on a signature. I hope it makes you chuckle.
http://www.elkvalleygold.com/Forex/F...%20Nov%202.jpg
Let's look at the hourly EURUSD chart that we have been following.
First of all the hourly big picture:
Our count may change a bit as the software deals with the wave four. It is always interesting to see the possibilities that the wave count presents but we want to trade as well. Using a breakout past the fractals works well as always.
Remember, if the count is confusing you are probably in a wave four of some degree.
http://www.elkvalleygold.com/Forex/F...0Nov2%20H1.jpg
Now the detail as we zoom in on the hourly chart:
There are some nice fractal breakouts here that I have been using to advantage. However, I do not want to get into the minute by minute waves and torture myself. ELWave is extremely good at pulling order out of the chaos of lower time frames. My thinking is why bother?
If I set out to paint my house I select a big paint brush not an tiny artist's paint brush. if the object of trading is to make money, then go for the easy money and the big money. Don't get trapped into a fascination with the minute by minute stuff.
You can paint a house with an artist's brush but that is insane. Maybe you can trade one minute charts but try using a bigger brush for bigger results. I can be an EW artist but I have been there and done that in OEX options and it makes you are a slave to your computer.
H1 (hourly) is as far as care to delve in to EW structure. I have been doing so here because I am trying to explain how I use the ELWave software, but daily is where it is at for me. I like the big brush for a big job.
Let's look at the Bill Williams approach on a daily chart after the detail is observed.
http://www.elkvalleygold.com/Forex/F...1%20detail.jpg
The Daily chart using the classical Bill Williams indicators:
How many 1 hour trades are there in this chart?
You have seen how I have used the H1 to get inside the daily waves and may even have played some of the H1 trades.
I use HI to verify where I am in the daily chart, I may even go smaller to verify the correct H1 count but ultimately I want to stay away from trading in the lower time frame.
Here is why:
I don't want to have to check my computer every hour or even every four hours to monitor my trades. I certainly don't want to check it every 5 minutes... though there are ways to get around that with some new trailing stop software I have been testing.
(Check the http://www.forexfactory.com/showthread.php?t=218567 thread on Forex factory.)
What I like to do is only have to check once a day.
Here are three trades that are all BW strategy. Together they took about three months and involved runs that totaled a bit over $25000 using one contract. Can you find enough trades that run $25000, trading one lot per time, in a 5 minute chart in those three months? Maybe. I don't care to make that much effort and tie myself to a terminal for all the hours required.
I eyeball the MT4 chart for the possible wave count and then run the same data through ElWave. When the EW counts match and my thinking is confirmed, then I watch the fractal that at will trigger a trade.
It is not very exciting. It requires patience. Acton junkies need not apply.
As you can see the AC has three green bars, The AO has turned green, there is a fractal waiting above the red alligaor line. The eyeball count suggest a fifth wave may occur if that fractal is taken out .
http://www.elkvalleygold.com/Forex/F...202%202010.gif
The last chart is the matching ElWave count. It is one of several counts that all end in the same pattern we are following. I selected it as it fits with the AO. Remember that it is compressed.
Fit it all together; Bill Williams, ELWave; the indicators the fractals and I have a buy stop in above that fractal. Its all about probabilities and that is as good as I can make it.
A special note. I am using data from IAMFX. Your broker data may look a bit different. I am also scaling my ElWave charts in linear format. I am not using semi-log scaling as MT4 does not offer that and I am trying keep confusion to a minimum. ELWave charts are compressed to make them fit on to the screen so they will look different from MT 4 charts
I appreciate the PMS that I have been getting and hope I have answered all the questions here. I also have decided on a signature. I hope it makes you chuckle.
http://www.elkvalleygold.com/Forex/F...%20Nov%202.jpg