The new rules:
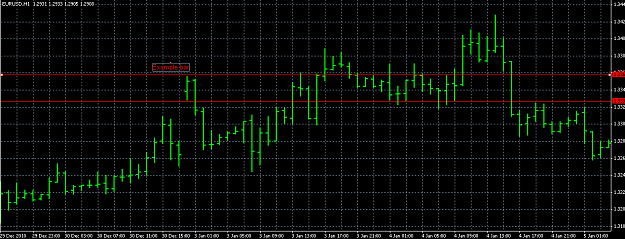
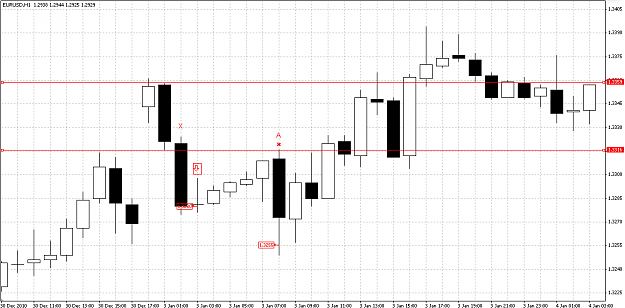
1 - Draw a line for the last candle's high and one for the low.
2 - The breaking is coming soon. If a candle break the line, start to count... one closed below the line, second close below the line, third close below the line. If one candle break the other side (in this case above the line) stop the count, and start the other side's counting. If the third candle is closed exsample below the line, open a short.
3 - Take profit is the avarage HIGH LOW difference of the last week's bars. (1H chart = 24X5 candle's HIGH LOW difference)
4 - If a candle close on the other sode of the line, start to counting. If you count the third other side closing candle, close the old position, and open a new for the opposite way. (old:short-> new: long)
5 - Take profit if the first is loser: When we have the winner last trade we sum up the losses(and spreads) and we take profit at the two times of the losses. (exsample: all loser trade: -200$, take profit: +400$)
Danger: Drawdown
Why is it good? If I had a -10% DD, after the last trade I have +10% profit on my account.
It works better and safer on bigger timeframes.
Ask me!
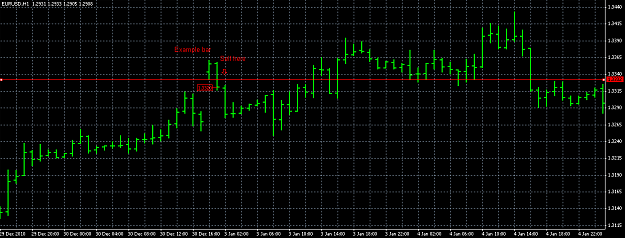
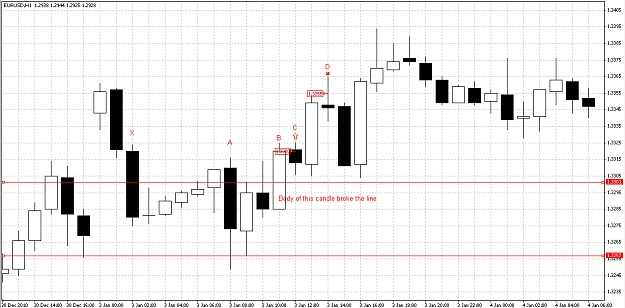
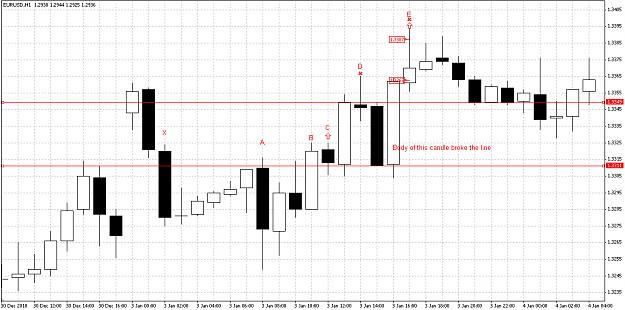
About the picture:
0 - Draw a line on the lowest (one candle before the "A")
1 - At "A" start to counting.
2 - At "B"'s close open a short
3 - Counting to long... (blue numbers...) (the below the red line closer candles stop the counting)
4- At "C" we rich the third above closer candle, and open a long at the C's close price
5 - At the blue take profit line we reach our profit (two times bigger than the losses were)
1 - Draw a line for the last candle's high and one for the low.
2 - The breaking is coming soon. If a candle break the line, start to count... one closed below the line, second close below the line, third close below the line. If one candle break the other side (in this case above the line) stop the count, and start the other side's counting. If the third candle is closed exsample below the line, open a short.
3 - Take profit is the avarage HIGH LOW difference of the last week's bars. (1H chart = 24X5 candle's HIGH LOW difference)
4 - If a candle close on the other sode of the line, start to counting. If you count the third other side closing candle, close the old position, and open a new for the opposite way. (old:short-> new: long)
5 - Take profit if the first is loser: When we have the winner last trade we sum up the losses(and spreads) and we take profit at the two times of the losses. (exsample: all loser trade: -200$, take profit: +400$)
Danger: Drawdown
Why is it good? If I had a -10% DD, after the last trade I have +10% profit on my account.
It works better and safer on bigger timeframes.
Ask me!
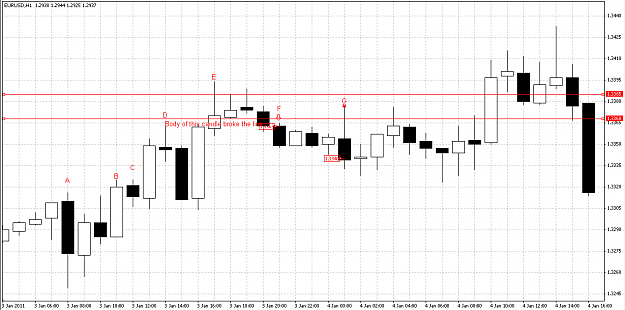
About the picture:
0 - Draw a line on the lowest (one candle before the "A")
1 - At "A" start to counting.
2 - At "B"'s close open a short
3 - Counting to long... (blue numbers...) (the below the red line closer candles stop the counting)
4- At "C" we rich the third above closer candle, and open a long at the C's close price
5 - At the blue take profit line we reach our profit (two times bigger than the losses were)
Attached Image (click to enlarge)
Develop the old ways! Backtest with 25% quality... JOKE!