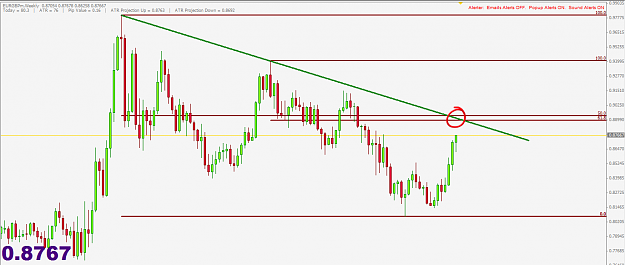
for some reason those last 2 charts that i posted did not update the candles. Anyway is this similar to what you have
Bearish Outside Bar
Trendline
.8700 RN and previous S/R


Bearish Outside Bar
Trendline
.8700 RN and previous S/R
Attached Image (click to enlarge)
Attached Image (click to enlarge)