Joined Jul 2009
|
Status: The Alchemist
|8,917 Posts
I've got some inquires regarding our current open:
Here is our most recent trades:
Long U/Chf +45pips
Short E/U +60pips
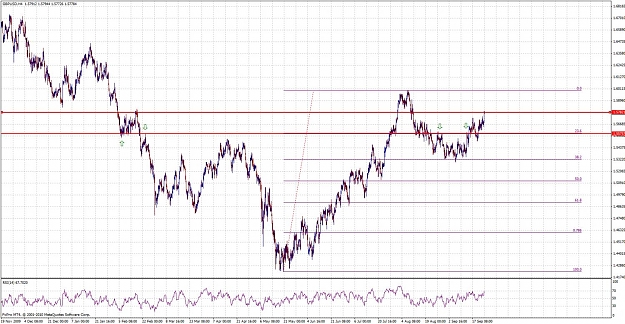
Short A/U +40pips
Note that the charts for all these trades have been provided here in advance,particularly note the chats on a/u that we mentioned .9650 as a solid R back in 08.
Hi Shahab,
Interesting Gold graph. I have to say its the same interpretation as EWI, as was your previous EURUSD graph, and in my experience, and as EWI are so poor at charting, if I have the same view as them I'll spend time looking for an alternative view.
Do you have any stop or targets on your Gold trade? Cheers
Ignored
I haven't seen EWI charts on Gold & E/U yet.It's interesting to know they have the same view. Are you paying for their services?
Regarding their charting, as far as I'm know, they are not bad at all,they might have some wrong prediction but everyone has.They are bunch of experienced professional for instance Jim Martens their currency strategist has working experience along side G.Soros.
Ive had the opportunity to view their work for many years, and I have to say they have some interesting articles - their non-EW related analysis i quite good - but their EW analysis more often than not, and ironically, lets them down.