I noticed last night on this thread a few traders drawing lines all over the place on a chart ... diagonal lines joining any 2 points on a chart , pros do not typically use diagonall lines for supply and demand area. If you think that a diagonal line is being held or sold off look back in history it will be a pivot point high or low in the market. s/r or supply and demand lines are simple horizontal libnes on charts ... easy as that. Petar took and ej sell yesterday due to someform of flag formation he wanted to play . The only issues is he sold 10 pip above a major support line . I noted this in a post quickly when i saw his trade. Not sure what his stop was but he got stopped out as that support line held really well with stopping vol ion a 15 before the 200 pip up move.
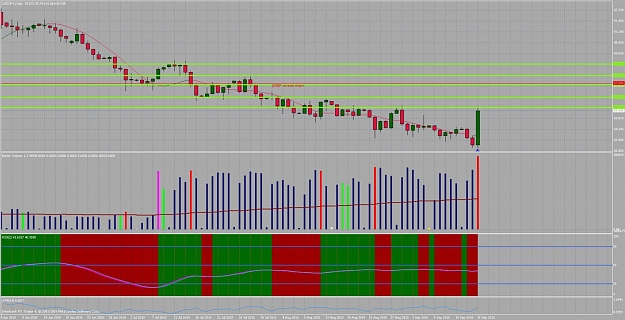
NOw lets look at eu .... look at your daily .... there is a support line under your entry at 1,2950 it was the high of 15th july and knocked market sideways a bit after that . So when you entered trade you effectively had 26 pips in which to get your stop to break even in case that support line held , which it did. You should have stayed with the trade knowing that the support line on daily was right under you , moving your stop to break even when you had +20 pip.
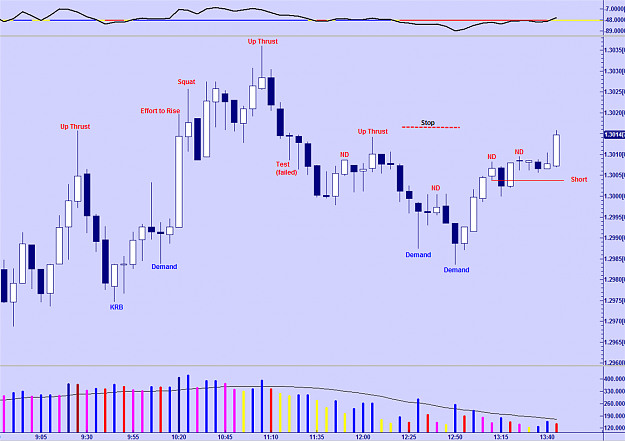
How do you know if a s/r line is going to hold or break. Pros will ALWAYS mark price rapidly thru s/r lines to lock in traders that would other wise be in a position against them ( ie profit taking ) or to keep from new traders entering the market at s/r areas ( ie pro is short they want to stop buyers entering and by moving price quickly thru the support line they can do this). Today I was in an eu long 1.3020 looking for a break out of 1.3030 into 1.3100. I liked the 60 min set up , higher lows and buyers supporting price. Price moved up to 1.3035 and stopped dead no mark up. I knew then that my trade was in trouble but wanted to give it time. Sure enough ultra high volume hit the 10 min candle that was an up bar and price dropped down to 1.2990. I closed trade immediately on the completion of the 10 min candle that failed to be marked up thru resistance 1.3035 and took a small loss.
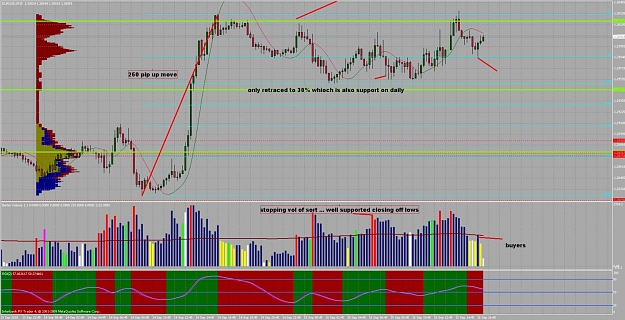
here is the chart ... although there does look like some buying to support a break out later ... maybe london , but I will wait for break out 1.3030 then a low vol test on a 5 for entry
i would not be selling eu just yet .. if anything wait for break down 1.2950 or buy off 1.2950 area IF support is seen using vsa
in fact petar sold rigght on a major support line on ej yesterday , that I saw being protected before the major move up
NOw lets look at eu .... look at your daily .... there is a support line under your entry at 1,2950 it was the high of 15th july and knocked market sideways a bit after that . So when you entered trade you effectively had 26 pips in which to get your stop to break even in case that support line held , which it did. You should have stayed with the trade knowing that the support line on daily was right under you , moving your stop to break even when you had +20 pip.
How do you know if a s/r line is going to hold or break. Pros will ALWAYS mark price rapidly thru s/r lines to lock in traders that would other wise be in a position against them ( ie profit taking ) or to keep from new traders entering the market at s/r areas ( ie pro is short they want to stop buyers entering and by moving price quickly thru the support line they can do this). Today I was in an eu long 1.3020 looking for a break out of 1.3030 into 1.3100. I liked the 60 min set up , higher lows and buyers supporting price. Price moved up to 1.3035 and stopped dead no mark up. I knew then that my trade was in trouble but wanted to give it time. Sure enough ultra high volume hit the 10 min candle that was an up bar and price dropped down to 1.2990. I closed trade immediately on the completion of the 10 min candle that failed to be marked up thru resistance 1.3035 and took a small loss.
here is the chart ... although there does look like some buying to support a break out later ... maybe london , but I will wait for break out 1.3030 then a low vol test on a 5 for entry
i would not be selling eu just yet .. if anything wait for break down 1.2950 or buy off 1.2950 area IF support is seen using vsa
Attached Image (click to enlarge)
in fact petar sold rigght on a major support line on ej yesterday , that I saw being protected before the major move up
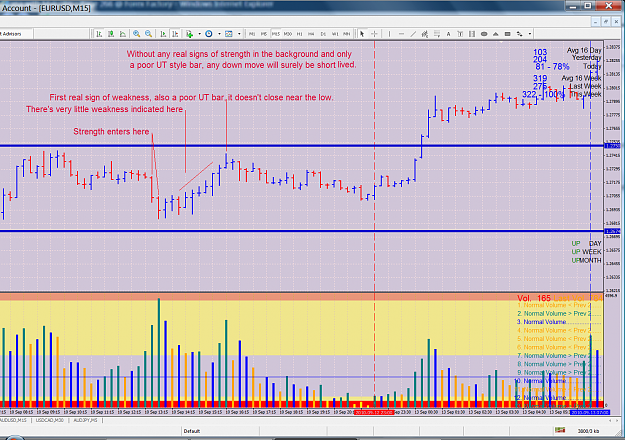
DislikedMy 9th VSA Trade (Live).
Executed Order.
EUR/USD - Short
Date: 15-Sep-10
Time: FxPro 11:00
Entry: 1.2976
SL: 1.3026 (-50 pips) (Above 1st Upthrust )
TP: 1.2926 (+50 pips)
Reasons:
Note the Red vertical line, the bar after this line is my signal bar.
Background Weakness, 2 UpThrusts.
Wait for break of minor support 1.2718.
Sell on Low of 2nd UpThrust Bar.
Hull Green on M15 and H1.
Hull Red on M30.
Attached:
M15
Entry (small Yellow horizontal line),
SL (small Red horizontal line),
TP (small Green horizontal line).
I will inform of exit...Ignored
Blogging daily now at www.volume.zone