http://www.forexrealm.com/technical-analysis/technical-indicators/commodity-channel-index.htmlFollow-up
For the purposes of scaling, Lambert has installed a constant at a level 0.015 that approximately from 70 up to 80 % of CCI values were between levels -100 and +100.
http://www.forexrealm.com/forex-imag...ators/cci2.gif Chart:
http://www.forexrealm.com/forex-imag...ators/cci7.png
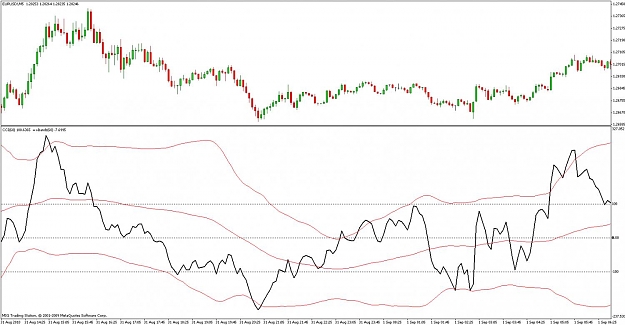
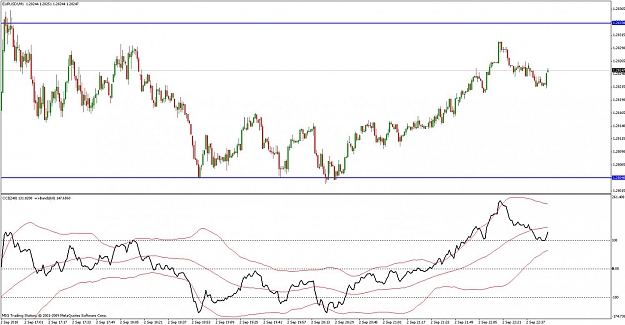
The Commodity Channel Index is moving over and under a zero mark. The percent of Commodity Channel Index values (between +100 and -100) correspond to the number of the periods used for its building. Shorter - with smaller quantity of the periods - CCI will be more inconstant, and if less - its values will be placed in a range section between +100 and-100. Correspondingly, the greater number of periods will be used for CCI measurement, the more values percent of the indicator will be between the points of +100 and -100.
The basic characteristic of the CCI named by the author is one-third of full cycle. For instance, from a minimum up to an upcoming minimum or from a maximum up to an upcoming maximum, or if a market movements' cycle is thirty days, recommended value for CCI is ten days.
Important: The determination of the cycle's length doesn't depend on the Commodity Channel Index and any other tools. It's is a rather many-sided indicator which can cause a wide range of purchase or sell signals. CCI is used both by investors and traders for determining of reversal price points. It is extreme on the price chart and trend force and its results should be used together from the rest of indicators.
How to use CCI
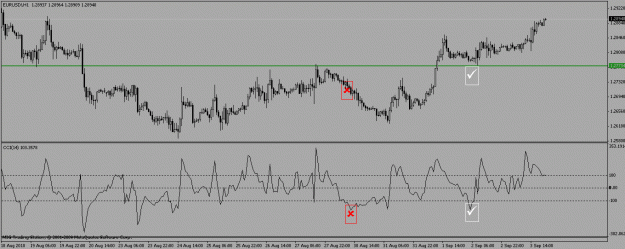
Here is the author's advice on the work with the CCI index in case it moves above +100 and below-100 and sends sell or purchase signals. Buy or sell signals happen 20 - 30 % of the time while from 70 up to 80 % of time Commodity Channel Index's value is fluctuating between +100 and -100. It's supposed that if CCI overcomes the level of +100 from below upwards, it means that the currency pair is moving in the direction of the strong ascending trend, thus there is a clear purchase signal. And once CCI goes under +100 the position is supposed to be closed on a return signal. At the same time, it's considered that if Commodity Channel Index moves to -100 point from top to down, it means that the currency pair is meeting a strong descending trend, and there's a sale signal. As soon as CCI again crosses the level of -100 this position is considered closed.
Later CCI started to work for determining if market is overbought or oversold, for definition of reversal points. The currency pair is considered overbought once it overcomes +100 level and is oversold once CCI goes under -100 point. While CCI stays in an overbought position which is above +100, the sale signal appears in case if CCI crosses a level +100 in the opposite direction - from the peak to the bottom. After CCI has entered into an oversold zone which is under -100 level, the purchase signal appears when CCI crosses -100 point in the opposite direction - from the bottom to the peak.
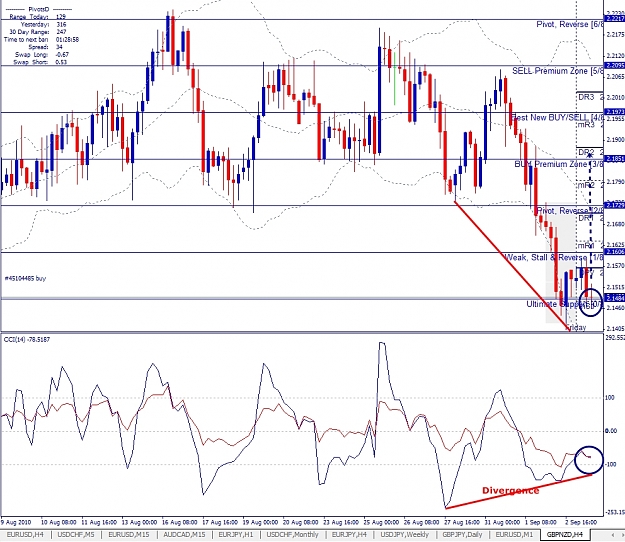
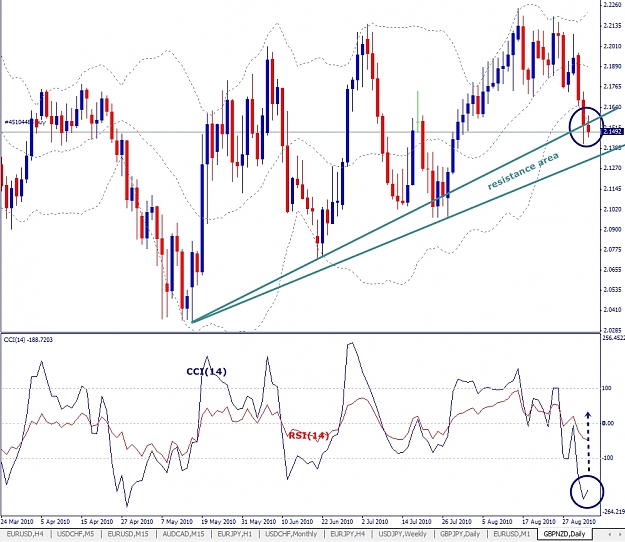
CCI is based on divergence analysis which widens a trading signal. Positive discrepancy less than -100 increases the signal force when the price crosses a level-100 from the bottom to the top. It happens only if there are 2 consecutive minima on CCI when the second minimum is more than the first one on the indicator but below the first one on the chart of prices. Negative divergence over +100 increases the signal force when CCI crosses +100 from top to bottom. The condition for this situation is 2 consecutive maxima on the indicator above +100 when the second maximum is under the first one on the indicator, but above on the chart of prices.
One can treat break of trend lines formed on the indicator as input or output signals from a position. At overbought - above +100 - the break of the trend line downwards is supposed a sale signal and at an oversold level - below-100 - the break of the trend line upwards is supposed a signal to growth of the market. Thus these lines are also based on the connection of consecutive maxima or minima.
The drawbacks of Commodity Channel Index
The CCI works effectively only in cases when the market is really subject to rather permanent cycles because it was developed definitely for the cyclic markets. That's why it's more problematic to choose an optimum period if Forex cycles are difficultly distinguished in market. Caution: Every, even an irreproachable indicator used wrongly results in a number of false signals and accordingly causes considerable losses in your deal. So before using any indicators on real accounts, first test their work for the demonstration account or check them as trading strategy.
For the purposes of scaling, Lambert has installed a constant at a level 0.015 that approximately from 70 up to 80 % of CCI values were between levels -100 and +100.
http://www.forexrealm.com/forex-imag...ators/cci2.gif Chart:
http://www.forexrealm.com/forex-imag...ators/cci7.png
The Commodity Channel Index is moving over and under a zero mark. The percent of Commodity Channel Index values (between +100 and -100) correspond to the number of the periods used for its building. Shorter - with smaller quantity of the periods - CCI will be more inconstant, and if less - its values will be placed in a range section between +100 and-100. Correspondingly, the greater number of periods will be used for CCI measurement, the more values percent of the indicator will be between the points of +100 and -100.
The basic characteristic of the CCI named by the author is one-third of full cycle. For instance, from a minimum up to an upcoming minimum or from a maximum up to an upcoming maximum, or if a market movements' cycle is thirty days, recommended value for CCI is ten days.
Important: The determination of the cycle's length doesn't depend on the Commodity Channel Index and any other tools. It's is a rather many-sided indicator which can cause a wide range of purchase or sell signals. CCI is used both by investors and traders for determining of reversal price points. It is extreme on the price chart and trend force and its results should be used together from the rest of indicators.
How to use CCI
Here is the author's advice on the work with the CCI index in case it moves above +100 and below-100 and sends sell or purchase signals. Buy or sell signals happen 20 - 30 % of the time while from 70 up to 80 % of time Commodity Channel Index's value is fluctuating between +100 and -100. It's supposed that if CCI overcomes the level of +100 from below upwards, it means that the currency pair is moving in the direction of the strong ascending trend, thus there is a clear purchase signal. And once CCI goes under +100 the position is supposed to be closed on a return signal. At the same time, it's considered that if Commodity Channel Index moves to -100 point from top to down, it means that the currency pair is meeting a strong descending trend, and there's a sale signal. As soon as CCI again crosses the level of -100 this position is considered closed.
Later CCI started to work for determining if market is overbought or oversold, for definition of reversal points. The currency pair is considered overbought once it overcomes +100 level and is oversold once CCI goes under -100 point. While CCI stays in an overbought position which is above +100, the sale signal appears in case if CCI crosses a level +100 in the opposite direction - from the peak to the bottom. After CCI has entered into an oversold zone which is under -100 level, the purchase signal appears when CCI crosses -100 point in the opposite direction - from the bottom to the peak.
CCI is based on divergence analysis which widens a trading signal. Positive discrepancy less than -100 increases the signal force when the price crosses a level-100 from the bottom to the top. It happens only if there are 2 consecutive minima on CCI when the second minimum is more than the first one on the indicator but below the first one on the chart of prices. Negative divergence over +100 increases the signal force when CCI crosses +100 from top to bottom. The condition for this situation is 2 consecutive maxima on the indicator above +100 when the second maximum is under the first one on the indicator, but above on the chart of prices.
One can treat break of trend lines formed on the indicator as input or output signals from a position. At overbought - above +100 - the break of the trend line downwards is supposed a sale signal and at an oversold level - below-100 - the break of the trend line upwards is supposed a signal to growth of the market. Thus these lines are also based on the connection of consecutive maxima or minima.
The drawbacks of Commodity Channel Index
The CCI works effectively only in cases when the market is really subject to rather permanent cycles because it was developed definitely for the cyclic markets. That's why it's more problematic to choose an optimum period if Forex cycles are difficultly distinguished in market. Caution: Every, even an irreproachable indicator used wrongly results in a number of false signals and accordingly causes considerable losses in your deal. So before using any indicators on real accounts, first test their work for the demonstration account or check them as trading strategy.