LOL, I missed that! But that is unbelievable!!!
This is one of those cases when I just don't believe my eyes!!!
How is this possible?
Every trade for this pair in the last year would be a winner (or BE at worst) how is this possible???
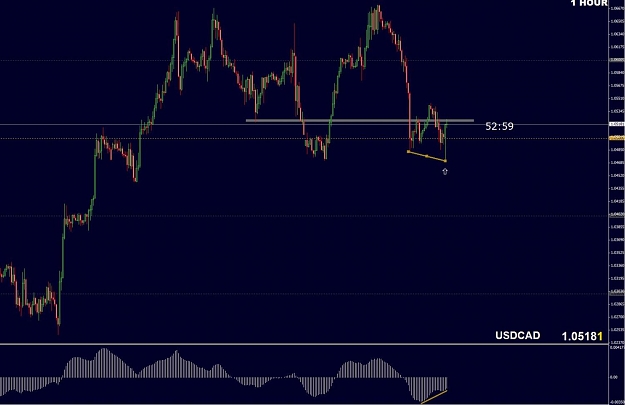
Lot of outside bar talk last few pages, thought I would post this AUDNZD demo trade I'm in. Thanks for the pointers on retrace of outside bars Jaroo. A lot of chart time last 4 weeks but no trades, so I've been studying.
Daily chart had PPZ, 61.8 fib, and RN confluence at 1.2800, also divergence.
Entered on retrace of 4H BEOB, with s/l outside of the BEOB and hard take profit.
Ended up trailing stops and am now at 1R locked in with a TP set at 1.267.
Ignored
That's freaking beautiful D., great entry Higher time frame levels and confluences then down to the 4 hour, nice size 4 hour bar, etc,
Well done sir.
Indicators show the past. Price Action "Indicates" the future.
I really think it is. I was skeptical a month a go and was looking for the evidence of this being just another commercial catch you know.
But now I see the only catch with this methods is a trader himself, simply - will
I have just a little discipline to follow my rules, and just simply execute these simple concepts? If so, the dream life is just around the corner.
|
Joined Feb 2010
|
Status: J16 Student
|902 Posts
this applies to me. may be to few others
when i see historical charts, i get lot of good signals and most of them are correct and profitable. but in real time i dont 'see' the same signal. may be due to over-analysis, negligence, fear etc. i am sure i would have missed 50% of those marked in your charts and picked a different set of signals that would have failed. so nett is BE
I need to build that capability to see the LIVE charts like historical charts and trade LIVE like a i would have traded seeing the past signals.
this applies to me. may be to few others
when i see historical charts, i get lot of good signals and most of them are correct and profitable. but in real time i dont 'see' the same signal. may be due to over-analysis, negligence, fear etc.....
Ignored
u addressed your own concern, Sir.
sooner or later, u will improve.
that is our natural progression... as long as we pursue excellence & dont quit
I cannot even imagine what's the Net Worth of some Seniors here....
Ignored
on one hand, the net worth of seniors here are immaterial to u.
u should concern yourself mainly of how much success u would attain once u keep focused, determined at this endeavor
i have a question. i was looking through the charts on daily, weekly, monthly.
i tried to draw PPZ, but i realized that most of my PPZ, is the PPZ for all three charts. am i doing it wrongly? i have 5PPZ drawn on daily, and 4 of them have the same PPZ on the weekly and monthly.
u will see examples of confluence in the free james16 videos & charts by the seniors here. there are a LOT of charts here to learn from.
trading style is congruent to your personality --- it boils down to what u want/dont want, what u like/dont like, what u love/dont love, what u are comfortable/not comfortable with.
based on your posts, it seems like u are not yet too familiar with yourself. u will find that trading will be an interesting journey to self-discovery.
Good luck & Keep at it!
Ignored
yeah.. i've yet to find one that really keeps me on. i'm jumping here and there. LOL. just like new traders does. (:
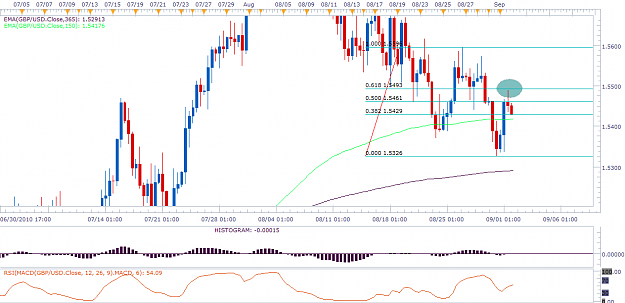
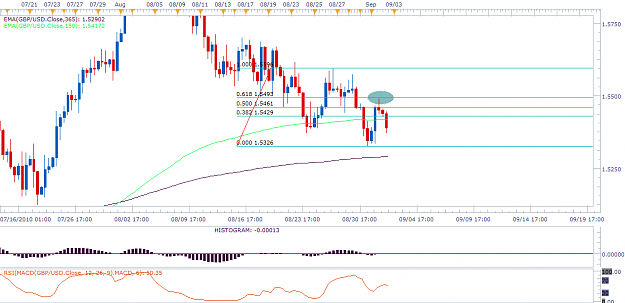
I will assume its about the importance of how a bar closes at a given level . . like a PPZ level and/or BRN.
Let's look at the GU on the Weekly, during the Fall of 2008.
We have a BRN, 1.5500, Price fails to Close below the 1.5500 on the Weekly and even the Daily. . .good indication that the 1.5500 is acting as Support.
Once Price breaks through and closes below the 1.5500, its a good chance that the 1.5500 will now act as Resistance.
We can see that once Price closed below the 1.5500 and even the Weekly and Daily Lows, they now acted...
i have a question. i was looking through the charts on daily, weekly, monthly.
i tried to draw PPZ, but i realized that most of my PPZ, is the PPZ for all three charts. am i doing it wrongly? i have 5PPZ drawn on daily, and 4 of them have the same PPZ on the weekly and monthly.
Ignored
no, u are doing great.
what happened is actually not surprising because u are essentially looking at the same price chart, only thru different timeframes.
it's like looking at a certain area or subject using different kinds of telescopes (monocular telescope, binocular telescope etc).
Hope that helps
|
Joined Jul 2010
|
Status: keeping it simple is complex enough
|989 Posts
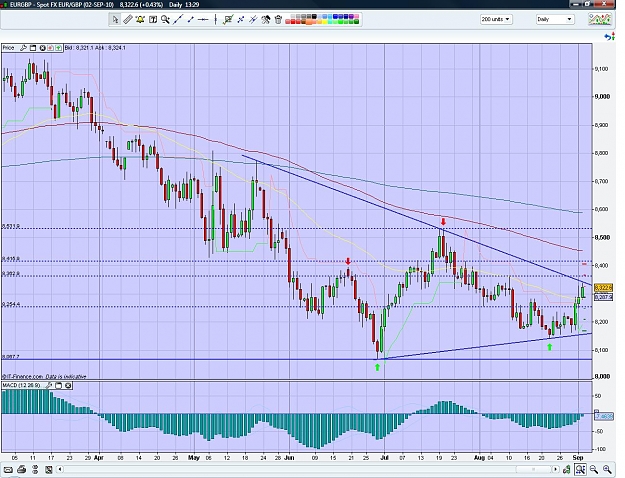
Hey Jarroo,
Any thoughts about the E-G. Price starts coiling up nicely and has made a higher low on the weekly. I wouldn't be surprised if we see a nice breakout to the upside, I'll be then looking for a break and a pullback as asual.
|
Joined Sep 2010
|
Status: on the way to becoming a pro.
|11 Posts
hi everybody, been here for a while, here im to share something with you.
i was using j16manager EA, but some time really want an EA that can move SL more than once. so found these 2, i tried both, either working fine:
first one IB partial close set by percentage
second one manageTP set by pips
hope seniors can have a test as well for everybody, hope you enjoy it.
no, u are doing great.
what happened is actually not surprising because u are essentially looking at the same price chart, only thru different timeframes.
it's like looking at a certain area or subject using different kinds of telescopes (monocular telescope, binocular telescope etc).
Hope that helps
Ignored
alright. does doing this help? as in drawing PPZ for the 3 TF on one chart. is this counted as confluence?