DislikedThabks for that. Might have a look when I get time.
Not much action around the 2727 area. Could drop a bit now, maybe under low volume.Ignored
Any volume comes in tho It will probably push I think.
VSA-divergence trading 187 replies
How to Blow $200 account using VSA--- 594 replies
VSA Journal 57 replies
VSA broker history change datas 11 replies
DislikedThabks for that. Might have a look when I get time.
Not much action around the 2727 area. Could drop a bit now, maybe under low volume.Ignored
Dislikedopen futures acocunt ...
mf global , Interactive brokers , or in Uki think you can use tradestation ( awesome charting software also for free if you do x amount of trades)
form there it is the same as fx .... vsa , s/r , etcIgnored
DislikedIgnored
DislikedMal would you say VSA is somewhat more accurate on the intraday scope of things.. as that is where dealers perform more 'pure' accumulation/distribution?Ignored
Disliked
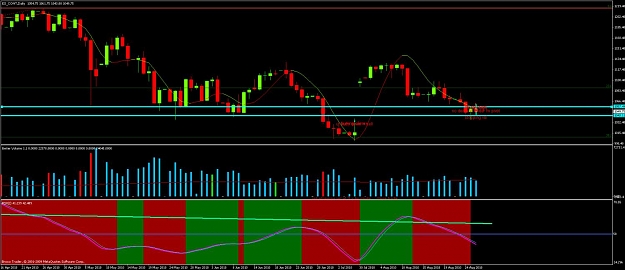
I have use it on daily charts for sure ...
but overall I liek to look at 60 min and 15 min
loojking at higher time frames is like reading the foront and back of the book , but misisng the middle and reading the true storyIgnored
Dislikedaj coming off a very nice double top
buying cliamxs x 2 on 2nd top also have UT
I am expecting that top to hold and see 74 or lower in coming session
out of both eu and gu longs.
Based on 60 min charts , GU 1.6000 holds and eu 1.2750 holds I willl only be looking for sells. Above these levels my view may change.
AttachmentIgnored
Disliked75 sell limit oirder hit .... next thing to be hit is my stop ...lolIgnored
DislikedFellas, been shortin EU from this level all day. From a VSA perspective, was the first a climatic high then a 'test'?
CheersIgnored
Disliked
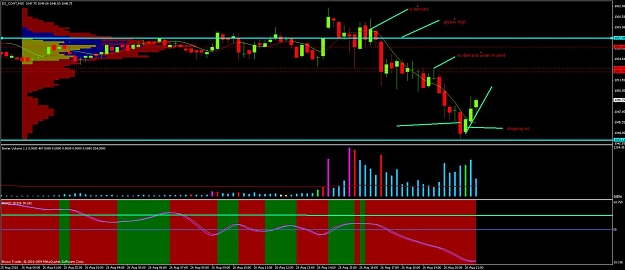
As soon as i saw Your chart i asked to myself - why price went up after Your marked buying climax.. Then i looked on my chart and say answer to my question.
You have different chart.
Or i have..
Best,
TomIgnored
DislikedIgnored
DislikedNo, its not a long signal, but it should be used as our edge that NOW we are loking for longs.
B,
TomIgnored
DislikedGotcha, thanks. I'm guessing the lower volume bullish pin next to it was a 'test' of some sortIgnored