Zoopy, thanks for pointing out Jarroo's post. I thought I was getting it until Jarroo said that the 108.39-109.09 range is too large.
I originally thought that 108.39 was a PPZ. Should PA start in the 108.30-108.50 range? Or should it just end in that range? Or should it extend throughout that range?
Ignored
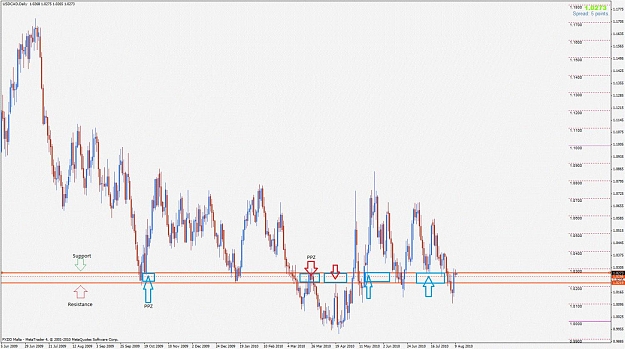
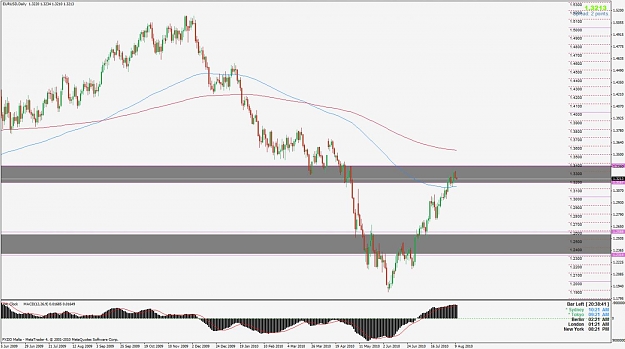
Here's an example of a PB at a PPZ level on the GU. Notice that the PB is at and through the PPZ level, the 1.6700ish. Also notice that PB closed below this level.
Do you see another example on this chart?
Attached Image (click to enlarge)
Indicators show the past. Price Action "Indicates" the future.
I figured if I sold the break below that bar on the 5th it equates to the same as a DBHLC setup, although on the day the bar wasn't massively bearish.
Actually there are 3 bar highs in a row, not sure that alters it any.
Hope I make some sense.
edit: thanks ts63, you beat me to it!
Thanks
Ignored
ah ok well I don't think this one will close as a LC(remb the DBHLC must have a closer lower then the previous bars low. If the overall pattern did it would be more interesting closing outside of your wedge shape. It may end up that pinbar from a week back carries us lower. I would have liked to see an overall bigger bar setup even if it did close lower then the previous bar low(to really show strength and a break "out" of the formation
...I would have liked to see an overall bigger bar setup even if it did close lower then the previous bar low(to really show strength and a break "out" of the formation
Best
Mike
Ignored
Ah yes, I missed the fact it hadn't quite closed below the previous bar - a crucial detail though!
Agreed on the big bar setup Mike, that would be great to see.
Here's an example of a PB at a PPZ level on the GU. Notice that the PB is at and through the PPZ level, the 1.6700ish. Also notice that PB closed below this level.
Do you see another example on this chart?
Ignored
and here an exemple with a pinbar which closed above a ppz (52usd)...
Think of a PPZ level as a "live electrical wire" and Price as a "squirrel". When Price (the squirrel) hits the PPZ level (the live electrical wire) that Price is going to jump one way or the other.
Ignored
From now on, every time I draw out my PPZs, I'm going to be seeing images of BBQ'd squirrels.
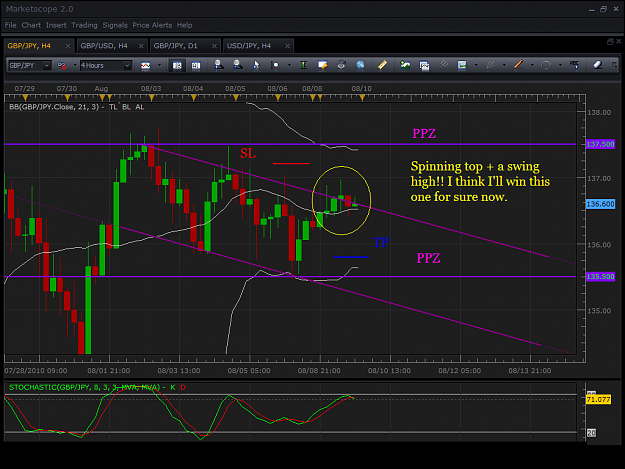
Here's an updated chart of my trade. I'm going short and it's a 4 hour view. Let me know what you guys think. Did I do good, would you guys do the trade on this type of setup, or based off of what my chart shows? Thanks.
ah ok well I don't think this one will close as a LC(remb the DBHLC must have a closer lower then the previous bars low. If the overall pattern did it would be more interesting closing outside of your wedge shape. It may end up that pinbar from a week back carries us lower. I would have liked to see an overall bigger bar setup even if it did close lower then the previous bar low(to really show strength and a break "out" of the formation
Best
Mike
Ignored
Hey Mike,
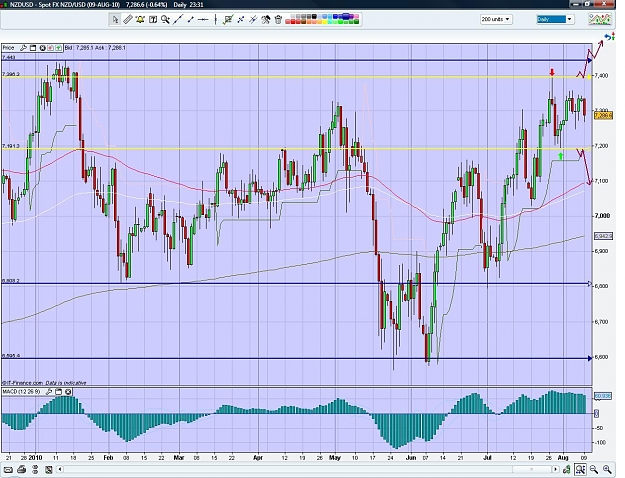
I've a remark on the kiwi. According to me this pair is consolidating at the moment on the daily between two BRN, range-support at about 7200 and range-resistance at about 7400. After its movement upwards the pair isn't making any new highs. As this pair is ranging it is better not to trade this pair, at least on the daily TF, one could of course trade the range on the lower TF. If price breaks the 7200, the trend will reverse and price could drop to the 6800 area where a weekly PPZ is situated. If price breaks the 7400 and subsequently the 7440 (weekly PPZ) then price will continue its previous uptrend. So we must wait for this consolidation to break. This concludes my analysis on the kiwi, please give me your expert opinion on this one.http://cdn.forexfactory.com/images/icons/icon10.gif
Hey Mike,
I've a remark on the kiwi. According to me this pair is consolidating at the moment on the daily between two BRN, range-support at about 7200 and range-resistance at about 7400. After its movement upwards the pair isn't making any new highs. As this pair is ranging it is better not to trade this pair, at least on the daily TF, one could of course trade the range on the lower TF. If price breaks the 7200, the trend will reverse and price could drop to the 6800 area where a weekly PPZ is situated. If price breaks the 7400 and subsequently...
Ignored
Hey zhang
thanks for sharing your analysis seems all logical to me.
I think if this bullish flag is valid we can expect a move in the long term to retest the high of the flag pattern just above the BRN above 7500. There was a pinbar off this pattern, but the pattern was sort of shifty over the last few weeks so I didn't pull the trigger on it
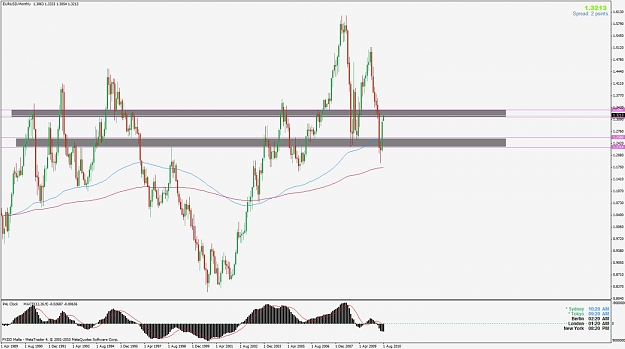
On your chart you have two levels marked off. Are you saying they are two separate zones? I'm asking because in your link you said "The area between the Sup and Res levels is the PPZ". I thought that means the area between 109.09 and 108.39 is the area where I would look for PA? That make sense? Something tells me I still have it wrong lol...
Ignored
Zoopy.
Many thanks for bringing this up and pointing us to that chart of Jarroo's.
Many times I have found myself drawing PPZ but, when I go back and look at the chart, I realize that often I have really only being drawing either the support or the resistance. Then thinking about this, sometimes I could not see the difference between S&R & PPZ. This post you made with Jarroo explaining it, greatly clears things up.
Now, I can look at the chart sort of like this and not get so confused.
EDIT: This concept really helps me look at PPZ as areas or ZONES rather than Lines as I was formerly perceiving them.
Great stuff, and it shows how when someone asks a question and we get an answer, it helps so many of us who had not yet formulated the question.
i have the same problem to draw the PPZ ,i study the thread for a long time ,i have patient to read the whole pages because i am a newbie to this theard 5 months ago ,now i finish 1570 page,because i want to be a winner...
Here's an updated chart of my trade. I'm going short and it's a 4 hour view. Let me know what you guys think. Did I do good, would you guys do the trade on this type of setup, or based off of what my chart shows? Thanks.
You win. Good one. I was also looking at the same setup. But later decided not to take the trade because I thought the trendline was broken already and it will continue to go up. Drawing trendlines differ from people to people, so I think they are less powerful than S/R which are easier to draw.
Many thanks for bringing this up and pointing us to that chart of Jarroo's.
Many times I have found myself drawing PPZ but, when I go back and look at the chart, I realize that often I have really only being drawing either the support or the resistance. Then thinking about this, sometimes I could not see the difference between S&R & PPZ. This post you made with Jarroo explaining it, greatly clears things up.
Now, I can look at the chart sort of like this and not get so confused.
EDIT: This concept really helps me look at PPZ as areas...
Ignored
Hi Pinbar
I was doing exactly what you were doing. I was using just lines but then I saw that post because I was trying to find more information on PPZs. It would be very helpful I think if that post was mentioned in post #1
I was doing exactly what you were doing. I was using just lines but then I saw that post because I was trying to find more information on PPZs. It would be very helpful I think if that post was mentioned in post #1
Seems to approaching a strong weekly ppz at 1.6500 with some fib confluence. Also divergence on daily. What would really be nice to see would be a climb to 1.7500, which looks to be an even stronger ppz.