This is a short-stock trade idea for next week.
I noticed a lot of you keep trading journal. I think it is a great thing to analyze self performance over time. I will do the same
Ignored
Anyone can share ideas on keeping journals or some software that can help? Much appreciated.
you can see it in the link (upper right corner; thread is called 'nearly naked').
i hope you don't take my post as an offense. i am just asking why the fibs are supposed to be false.
you can see it in the link (upper right corner; thread is called 'nearly naked').
i hope you don't take my post as an offense. i am just asking why the fibs are supposed to be false.
Ignored
No, I don't take your post as being offensive.
I take the guy who posted that as being offensive!
Those fibs were drawn to look for confluence and we can clearly see the 50 fibo is indeed the 50 fibo.
Also, if they were incorrect, I am sure someone in this thread would have pointed it out.
Ok, lets ask in this thread.
Are these fibos intended to look for confluence drawn incorrectly?
This is a weekly chart and the only way to find fibo confluence is to use these two swing highs.
Anyone can share ideas on keeping journals or some software that can help? Much appreciated.
Ignored
Best software for this IMO is Excel. But it is also good to have screenshots of your trades, IMO. So I think I would use excel spreadsheet and this forum.
For now I just enter all trades in excel and I have a separate folder in my PC called "My trades" where I save screenshots of all my trades (before and after)
I notice that you rarely seem to draw horizontal PPZ lines.
And just seem to use the rectangle function to mark off traffic.
Are you just eyeballing the PPZ on weekly and remembering them or just eyeballing the areas on the TF you are working on?
Looks really simple compared to what I am doing but then again, of course you have practiced a lot.
Note in the daily chart I still have that horrifying feeling, I am missing PPZ at the green rectangle areas.
Any tips appreciated.
Ignored
hey Pb,
yeah I don't draw horizontal lines on my chart. First because I don't touch trade I only go into the details of location and round numbers when I see a PA setup that I feel is good enough. Secondly an obvious PPZ does jump out at me without a horizontal line indicating that and it could be due to the chart time yes.
It just takes some time, but then of course you might want to keep using horizontal lines if you find them useful. A few lines on the chart sure don'tt clatter the chart.
Anyone can share ideas on keeping journals or some software that can help? Much appreciated.
Ignored
hey Jey,
The best thing you can do is to keep a journal where everyone can see your trades. It keeps you from taking foolish trades or trades that go against your stated rules because you then hate to post such trades up at your journal and let the world know you've been fishing outside your trading parameters. It also helps because people who read through your journal often congratulate you on great trades (which boosts confidence) and have advices and suggestions to offer if you enter in a loosing streak which again helps.
An excel spreadsheet alongside a journal to do the math and statistics also helps.
without reading any other post but yours, i tend to agree with your superstition.
i know in the past i have seen that people have traded hilariously big outside bars as if thats what they spend all day waiting for. to me it would be about RR, and to see someone factor in the huge size of the bar to create their position size and then move their stop up out of being anxious, it seems wasteful and backwards. its like paying 100,000,000 dollars for great live insurance and then living in your panic room. abnormally huge bars are funny to me.
I finished reading your thread Jim. It was very interesting to read about your journey. I was inspired to back test your style of trading (price action usage; such as, double tops, double bottoms, pin tops, etc.) on a gbp/jpy day chart. The results of my price action trading were amazing! I simply scrolled to a random place in the chart and started back testing your theories. After about 100 back test trades, my win to loss ratio stood at 82:18! Nearly 80% win rate, with only using price action! No news, no trend lines, no mvas, emas, or anything...
Ignored
Welcome Novak
Another way to practice is to use your back tester, Watch the PA,
And paper trade it, To see how you do. Or download a manual backtest EA.
You can pause it, And put in S/R line, Or Fib lines. It can be a great training tool.
yeah I don't draw horizontal lines on my chart. First because I don't touch trade I only go into the details of location and round numbers when I see a PA setup that I feel is good enough. Secondly an obvious PPZ does jump out at me without a horizontal line indicating that and it could be due to the chart time yes.
It just takes some time, but then of course you might want to keep using horizontal lines if you find them useful. A few lines on the chart sure don'tt clatter the chart.
g.
Ignored
Greetings Ghous,
Just great to hear this remark of yours concerning drawing lines on the chart. My first working method of analyzing price charts was to draw the supply and demand lines according to a top-down approach, starting from the higher timeframes down to the lower timeframes . After that I began to look for PA patterns in the vicinity of these drawn lines. But when there are to many lines on the chart the whole picture becomes messy and one tends to lose the overall picture. Because you always first start looking for a PA pattern and then look at its specific position in the overall chart, I decided to delete all the lines from the lower timeframes except for one higher timeframe. Now when I see a PA pattern, I first look at its position within the higher timeframe lines and if there no interaction I start to zoom into the lower timeframes and start to look for some interaction at wellknown positions (fib. levels, RNB,BRN, PPZ etc..).
I take the guy who posted that as being offensive!
Those fibs were drawn to look for confluence and we can clearly see the 50 fibo is indeed the 50 fibo.
Also, if they were incorrect, I am sure someone in this thread would have pointed it out.
Ok, lets ask in this thread.
Are these fibos intended to look for confluence drawn incorrectly?
This is a weekly chart and the only way to find fibo confluence is to use these two swing highs.
Ignored
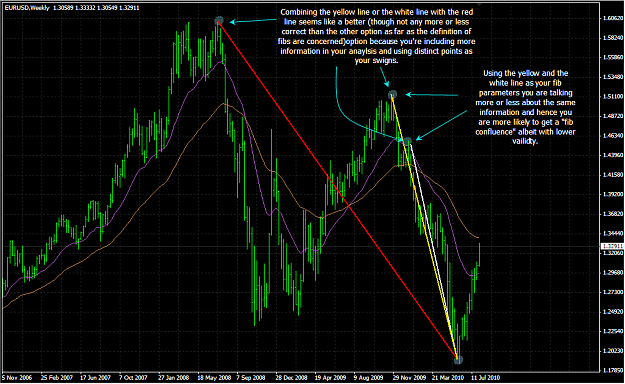
These are definitely not incorrect.
As long as a fib ret starts at a swing high and ends at a swing low, the fibs are valid.
What I think I understand from this person's post who critiqued your chart is that the swings that are used to draw the fibs need to be distinct and and less over lapping and this though isn't totally wrong either.
Looking at your chart the difference between the 2 swing highs that you have used is pretty small while the swing low is the same for both rets hence the 2 pair of fib levels don't differ a great deal in terms of the information they denote,
It's one and the same thing. First trouble area refers to minor/major S/R flip that is the first source of possible hiccup for a PA setup and it is widely used by J16ers as the first target area or first profit taking area as well.
Greetings Ghous,
Just great to hear this remark of yours concerning drawing lines on the chart. My first working method of analyzing price charts was to draw the supply and demand lines according to a top-down approach, starting from the higher timeframes down to the lower timeframes . After that I began to look for PA patterns in the vicinity of these drawn lines. But when there are to many lines on the chart the whole picture becomes messy and one tends to lose the overall picture. Because you always first start looking for a PA pattern and then...
Ignored
However there is a catch to doing your analysis there and then after the formation of the PA bar. you can get blindfolded by how good the bar itself looks, and that can lead you to curve fitting of PPZs and hence give you a false signal to enter.
This is precisely why I still would recommend to all those who are new to this to continue to use the top down approach and mark every important area out there, just so you know in a glimpse when a PA bar is rightly located and when it is not.
As long as a fib ret starts at a swing high and ends at a swing low, the fibs are valid.
What I think I understand from this person's post who critiqued your chart is that the swings that are used to draw the fibs need to be distinct and and less over lapping and this though isn't totally wrong either.
Looking at your chart the difference between the 2 swing highs that you have used is pretty small while the swing low is the same for both rets hence the 2 pair of fib levels don't differ a great deal...
Ignored
Hello guys i must say what you talk lol
I posted to Naked thread his chart also i didnt say the name of person.I posted for educate reasons.i didint offensive or something like that lol
As you know if you draw Fib you must looks last highers swing and lower if you want larger Fib we need most Higher Swing.I posted that to advice him to look better on chart and maybe to read books about Fibing to undestand better Fib. I didnt tell his chart is wrong (for me is wrong) and from some books i read nothing more...
ng to analyze self performance over time. I will do the same
Ignored