This is a thread dedicated to the discussion of the Monster Muncher EA, which the illustrious Steve Hopwood has coded and I have designed. All kudos to Steve for a great job on this EA.
I personally don't like putting robots on my account, so I only trade this manually. I have done some studies of the backtests results, which were good, but in practice it may have some problems as an auto-trader. Truth be told, I haven't utilized it enough forward testing as a robot to be able to give any kind of comprehensive reporting.
My own interests have been in the manual trading aspects alone, and so that is what I hope to cover here: how to trade MM for the best manually.
I have forwarded tested it manually and have done very well on my live account after a little practice on demo.
=====================================================
Important: This EA counts according to the GMT offset time of your broker. A broker with a GMT offset time of +2 will give different projections than a broker running on GMT.
I use IBFX which counts according to GMT. Any other GMT broker will give close projections to that.
I can't recommend using a non-GMT time broker for this system. I only have experience with IBFX. Brokers with a GMT offset time can seriously alter the results.
Best suggestion if you have a non-GMT time broker: Get a demo from a GMT time broker and take your signals off that.
Important #2: There is a bug in the EA which causes the charts to offshift every hour. You must refresh the template every hour-this will restore it to its original setting. Now that this info is up top and highlighted,
I will be ignoring any further questions about it on the thread. I have written this 5 or 6 times in the thread itself, even though it was already stated below in this first post. I can do no more.
One last time: You must refresh the template every hour.
Important #3: This is a strategy in development-I am urging people as they learn this strategy to either trade demo, or trade for a penny a point. This is common sense-use caution with your funds. Nothing in FX is certain
and all trades involve some element of risk. This is about creating a system which establishes favorable probabilities over time-not a holy grail. It takes time, study, and practice to become successful with any method.
=========================================================================================================================
So here is the basic breakdown of the system:
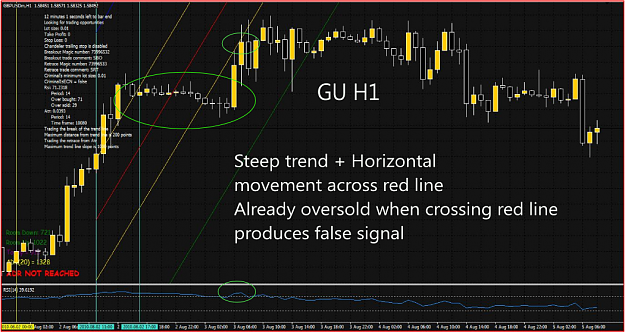
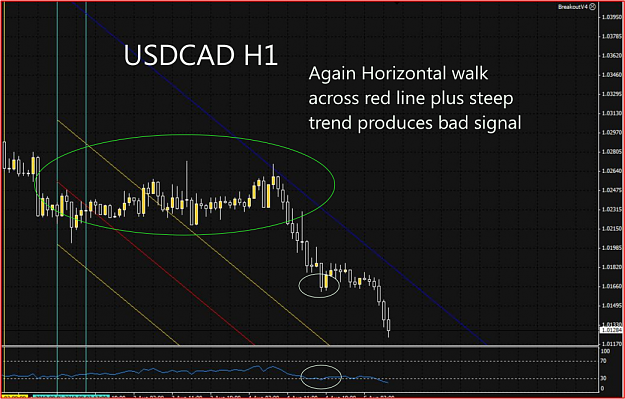
First I'll explain the lines. The center Red line, or Average line is the heart of the system. Here is how it is calculated:
It calculates the average range of the first 6 bars of the week( point #1), then it calculates the average range of the second six bars of the week(point #2), then the average range of the 3rd six bars of the week(point #3).
Then it takes the average of #1 and #2 and produces a fourth point, #4. The it takes the average of #2 and #3 produces a fifth point #5.
The red line is a straight line starting from point #4 going through the center of point #5.
This gives you the average trajectory of the first 18 bars of the week. It updates automatically every week.
Therefore it take 4.5 hours after the start of the week to calculate the red line on the 15 min chart, 9 hours for the 30 min chart to calculate, and 18 hours for the 1hr chart to calculate.
The top of the weekly ATR (Blue line) is placed above the Red line. The bottom of the weekly ATR (Green line) is placed below the Red line.
The Yellow lines which are very close to the Red Line are not used for signals, just for helping with observation of price action around the red line. They are not essential, but I find them helpful.
So, this system can give you four kinds of trades.
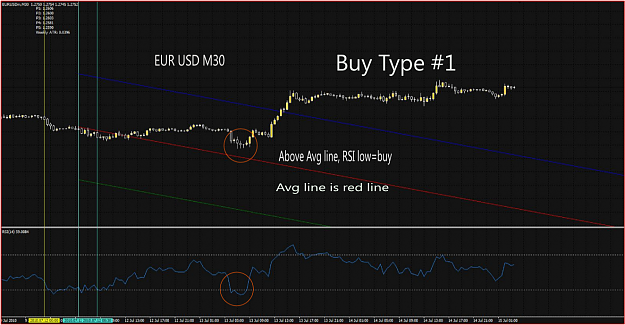
Buy #1: Price closes above Red line RSI is oversold.
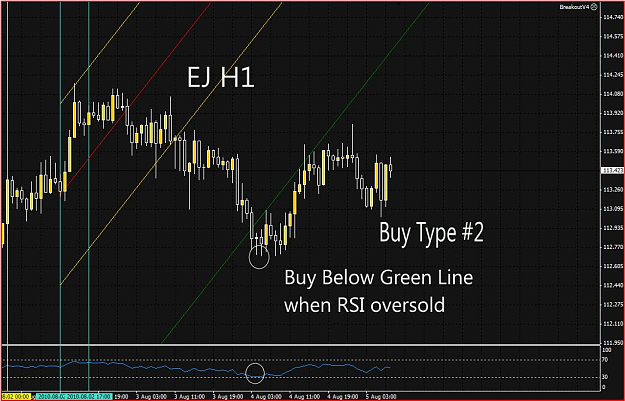
Buy #2: Price closes at or below Green line RSI oversold.
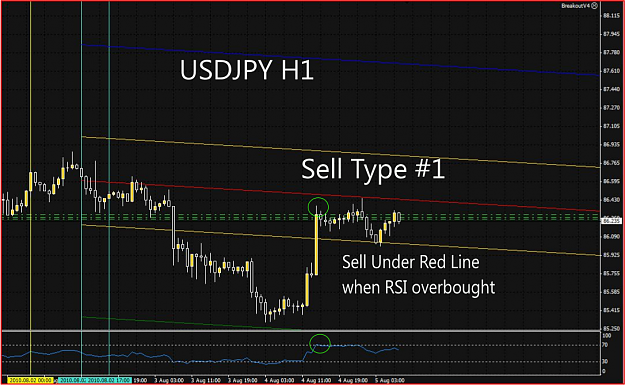
Sell #1: Price closes below Red line RSI is overbought.
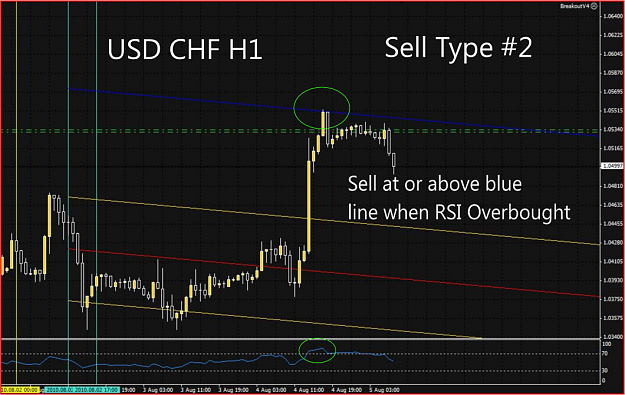
Sell #2: Price closes at or above Blue line RSI is overbought.
The 1Hr chart is the most reliable chart to trade in my exp. 15 min gives you a few more trades but can cause drawdown. I like to watch 15 min, 30 min, and H1 to see if they are giving me aligned signals, but only take my acutal signal off the H1.
You don't have to watch all three TF's, up to you. You can trade just off the H1.
=======================================================
Charts, EA, and template posted below.
EA goes in your broker>experts.
template goes in your broker>templates.
Template #1 is already set to disable live trading and alerts.
Template #2: also has lives trading and alerts disabled, but has user feedback turned off, and the ADR indicator removed. Its just the lines with the RSI, without any other kind of text. It looks cleaner.
Final Note: You have to refresh the template every hour if trading on the 1hr chart, every 1/2 hour if trading on the 30 min chart, every 15 min if trading on the 15 min chart. It will recaculate on each new bar it makes- just a bug-so to restore it to its original setting just refresh the template.
Also, obviously use common sense and practice on demo before any live trading. If downloading only the EA and not the template, make sure to uncheck allow live trading. Aside from that, enjoy!
====================================================
Types of set-ups to avoid coming in next post.
====================================================
More info concerning this system as a Robot and other Steve Hopwood Creations can be found here:
http://www.forexfactory.com/showthread.php?t=243432
===================================================
Updates:
8/7/10: Put up a corrected version of MM (mq4 file below titled 'breakoutv4), which has the yellow line settings correctly entered. The settings were entered rightly on the templates posted, but not on the bot itself.
"ATR Breakout Mulitplier" setting should read 0.162. This sets them at a distance from the red line where price action does significant things.
It also sets them at a distance where if you draw a trendline halfway between the lower yellow line and the green line, and one halfway between the upper yellow line and the blue line, you will get equal divisions
of 6 sections. Significant action can also occur around these 50% levels between the yellow and green, and yellow and blue lines. None of this changes the rules of the system, but its good for observation and
perhaps in the future something more will come of it.
This new version also has magic #'s set to 0, and trade comments set to 'none', to disguise them from brokers.
=================================================================================
8/21/10: Have refined the type 2 Retrace trading method using fibos. See post #120. Important improvements not to be missed.
==================================================================================
8/24/10: Have refined the type 1 Red line trades. Thanks to Ian for his help with this. See post #138.
===================================================================
I personally don't like putting robots on my account, so I only trade this manually. I have done some studies of the backtests results, which were good, but in practice it may have some problems as an auto-trader. Truth be told, I haven't utilized it enough forward testing as a robot to be able to give any kind of comprehensive reporting.
My own interests have been in the manual trading aspects alone, and so that is what I hope to cover here: how to trade MM for the best manually.
I have forwarded tested it manually and have done very well on my live account after a little practice on demo.
=====================================================
Important: This EA counts according to the GMT offset time of your broker. A broker with a GMT offset time of +2 will give different projections than a broker running on GMT.
I use IBFX which counts according to GMT. Any other GMT broker will give close projections to that.
I can't recommend using a non-GMT time broker for this system. I only have experience with IBFX. Brokers with a GMT offset time can seriously alter the results.
Best suggestion if you have a non-GMT time broker: Get a demo from a GMT time broker and take your signals off that.
Important #2: There is a bug in the EA which causes the charts to offshift every hour. You must refresh the template every hour-this will restore it to its original setting. Now that this info is up top and highlighted,
I will be ignoring any further questions about it on the thread. I have written this 5 or 6 times in the thread itself, even though it was already stated below in this first post. I can do no more.
One last time: You must refresh the template every hour.
Important #3: This is a strategy in development-I am urging people as they learn this strategy to either trade demo, or trade for a penny a point. This is common sense-use caution with your funds. Nothing in FX is certain
and all trades involve some element of risk. This is about creating a system which establishes favorable probabilities over time-not a holy grail. It takes time, study, and practice to become successful with any method.
=========================================================================================================================
So here is the basic breakdown of the system:
First I'll explain the lines. The center Red line, or Average line is the heart of the system. Here is how it is calculated:
It calculates the average range of the first 6 bars of the week( point #1), then it calculates the average range of the second six bars of the week(point #2), then the average range of the 3rd six bars of the week(point #3).
Then it takes the average of #1 and #2 and produces a fourth point, #4. The it takes the average of #2 and #3 produces a fifth point #5.
The red line is a straight line starting from point #4 going through the center of point #5.
This gives you the average trajectory of the first 18 bars of the week. It updates automatically every week.
Therefore it take 4.5 hours after the start of the week to calculate the red line on the 15 min chart, 9 hours for the 30 min chart to calculate, and 18 hours for the 1hr chart to calculate.
The top of the weekly ATR (Blue line) is placed above the Red line. The bottom of the weekly ATR (Green line) is placed below the Red line.
The Yellow lines which are very close to the Red Line are not used for signals, just for helping with observation of price action around the red line. They are not essential, but I find them helpful.
So, this system can give you four kinds of trades.
Buy #1: Price closes above Red line RSI is oversold.
Buy #2: Price closes at or below Green line RSI oversold.
Sell #1: Price closes below Red line RSI is overbought.
Sell #2: Price closes at or above Blue line RSI is overbought.
The 1Hr chart is the most reliable chart to trade in my exp. 15 min gives you a few more trades but can cause drawdown. I like to watch 15 min, 30 min, and H1 to see if they are giving me aligned signals, but only take my acutal signal off the H1.
You don't have to watch all three TF's, up to you. You can trade just off the H1.
=======================================================
Charts, EA, and template posted below.
EA goes in your broker>experts.
template goes in your broker>templates.
Template #1 is already set to disable live trading and alerts.
Template #2: also has lives trading and alerts disabled, but has user feedback turned off, and the ADR indicator removed. Its just the lines with the RSI, without any other kind of text. It looks cleaner.
Final Note: You have to refresh the template every hour if trading on the 1hr chart, every 1/2 hour if trading on the 30 min chart, every 15 min if trading on the 15 min chart. It will recaculate on each new bar it makes- just a bug-so to restore it to its original setting just refresh the template.
Also, obviously use common sense and practice on demo before any live trading. If downloading only the EA and not the template, make sure to uncheck allow live trading. Aside from that, enjoy!
====================================================
Types of set-ups to avoid coming in next post.
====================================================
More info concerning this system as a Robot and other Steve Hopwood Creations can be found here:
http://www.forexfactory.com/showthread.php?t=243432
===================================================
Updates:
8/7/10: Put up a corrected version of MM (mq4 file below titled 'breakoutv4), which has the yellow line settings correctly entered. The settings were entered rightly on the templates posted, but not on the bot itself.
"ATR Breakout Mulitplier" setting should read 0.162. This sets them at a distance from the red line where price action does significant things.
It also sets them at a distance where if you draw a trendline halfway between the lower yellow line and the green line, and one halfway between the upper yellow line and the blue line, you will get equal divisions
of 6 sections. Significant action can also occur around these 50% levels between the yellow and green, and yellow and blue lines. None of this changes the rules of the system, but its good for observation and
perhaps in the future something more will come of it.
This new version also has magic #'s set to 0, and trade comments set to 'none', to disguise them from brokers.
=================================================================================
8/21/10: Have refined the type 2 Retrace trading method using fibos. See post #120. Important improvements not to be missed.
==================================================================================
8/24/10: Have refined the type 1 Red line trades. Thanks to Ian for his help with this. See post #138.
===================================================================
Attached Image(s) (click to enlarge)
Attached File(s)