It is the most ideal case for me if the price hit the triangle lower TL and play it out as #19.10 with SL of 20pips instead of #19.9 on later time.
My target as indicated in chart is 140.55
Ignored
Thanks very much MPH, that was most helpful. For some reason I was looking at the more recent MACD lines above the 'waterlevel', and trying to project the target from there. I still got a lot to learn.
Possible 19.6 on the works for both fiber and cable.
I see gaps to be filled on both that could provide an entry @ TL touch.
Also looking at USDx.
Ignored
Hey JP. A respect to you for your logical chart viewing man.
#20.6 on GU small TFs with full ADR. Possible entry point to go to fill these gaps. What do you think?
Hey JP.
#20.6 on GU small TFs with full ADR. Possible entry point to go to fill these gaps. What do you think?
Ignored
Mr C, i always like to see yr setups in your journal. But it seems like you're following JP and belekas into smaller smaller TF like 5mins, not that it is wrong but just hope it is little part of your arsenal.
Mr C, i always like to see yr setups in your journal. But it seems like you're following JP and belekas into smaller smaller TF like 5mins, not that it is wrong but just hope it is little part of your arsenal.
Ignored
It's a part of a learning curve. The same thing here on smaller TFs just everything goes faster. And I'm a person who's beginning to like speed. Smaller TFs - smaller SLs. The journey starts on m1 via m5 and m15 to hourly or even monthly. That's the main idea. From Timex to Rolex via Forex, when your ready.
Hey JP. A respect to you for your logical chart viewing man.
#20.6 on GU small TFs with full ADR. Possible entry point to go to fill these gaps. What do you think?
Ignored
Most definitely. Just waiting for confirmation: div + TL break + ADR fill.
All in place than we enter.
Cheers,
JP.
PS: By the way m5 divergence already in place. Looking sexy. The same can be said about Geppy and Kiwi.
I think 18.4 setting up for cable in direction of MMOTW?
Ignored
Hi FXChi,
I was just reading through the Currency Trader article for this setup last night funnily enough. Trying to get my head around it at the moment. It's great you can spot it in real time. I posted a chart so the learners like me can see an example:
Attached Image (click to enlarge)
For me an almost perfect 18.4 setup, only small issue being the Intra low was 4683, and if following 18.4 exactly by the book and setting a Buy order at 30 pips above this low, the Buy Order would failed to have got triggered as the retracement low was 33 pips above at 4716.
Small issue, but otherwise very good setup. Wish I had seen it myself, to busy drawing a broadening triangle on this pair, which turned out to be a waste of time
|
Joined Dec 2007
|
Status: Cash Rules Everything Around Me
|749 Posts
Thanks niteshift02. I'm still learning too. Should be done with the thread in a couple days - read the book twice, took notes on it once, read the article twice. Need to review the book and the notes again. Will have to review the thread again too. But applying it in real-time is the only way to master it, so the crawl begins this week.
What you pointed out about the set-up being a nearly perfect 18.4 is what I was referring to in the edit about the trade not triggering. Not sure if there was another way to enter this, but from my understanding the master likes to place his stops on the opposite side of the intraday range or below another key technical level.
What you pointed out about the set-up being a nearly perfect 18.4 is what I was referring to in the edit about the trade not triggering. Not sure if there was another way to enter this, but from my understanding the master likes to place his stops on the opposite side of the intraday range or below another key technical level.
Ignored
Having just checked the article in Currency Trader again, he does say 'The risk on a single trade must not exceed 40 percent of the two-month average daily trading range'. So in today's case, ADR over 2 months is around 164 pips, so we could have entered around 65 pips above the Intraday low. However, this all comes down to an individual's preferance for risk, MM, lot size, etc.
So I guess we don't have to strictly stick to the 30 pip rule in the book. Besides, currency pair ADRs go through cycles where they expand and contract over a period of time, so to a certain extent it would make more sense for me to use percentages rather than strict number of pips when it comes to this particular template.
All I have to do now is actually find a trade setup to use this on!
|
Joined Dec 2007
|
Status: Cash Rules Everything Around Me
|749 Posts
Thanks Niteshift. I'll have to review the high volatility conditions like Sept 08 - March 09 roughly to gauge the better entry approach. ADR entry might make sense.
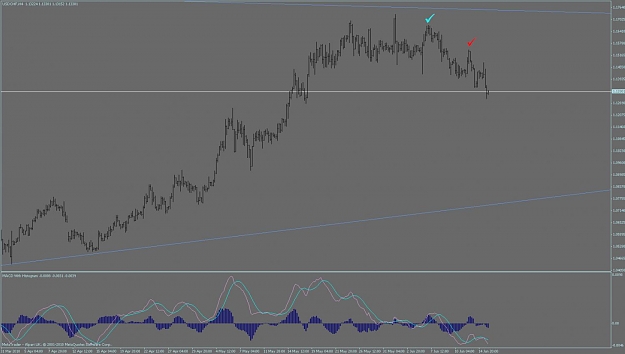
The other thing I'm trying to understand is the div targets that's been mentioned a few times in the thread. In some of the posts it seemed to change to me.
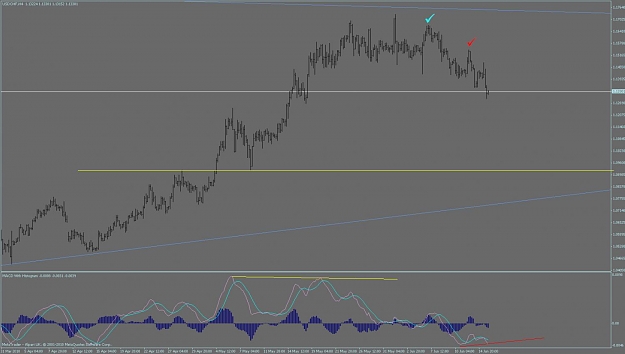
Can someone kindly point out in this example of USD/CHF 4hr if the div target is at the blue arrow or the red arrow (I think it's the blue)?
And to clarify so I have it correct, when checking for these targets, it is usually the high/low extreme right before the divergence signal?
|
Joined May 2010
|
Status: Looking for the KO trade
|471 Posts
Quote
Disliked
Thanks Niteshift. I'll have to review the high volatility conditions like Sept 08 - March 09 roughly to gauge the better entry approach. ADR entry might make sense.
I just use this indicator which tells me all the ADR data I need to know, ADR for last 60days, AWR, %of ADR completed, etc. This will help you decide your Profit target and other information which could prove crucial to your trade plan:
Apologies if you use this already. I can't trade without it, especially if you're using the Igrok method.
Quote
Disliked
The other thing I'm trying to understand is the div targets that's been mentioned a few times in the thread. In some of the posts it seemed to change to me.
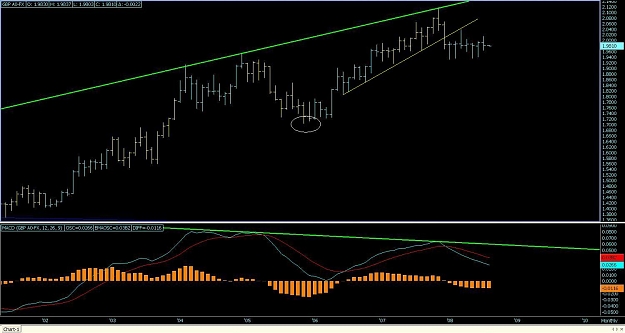
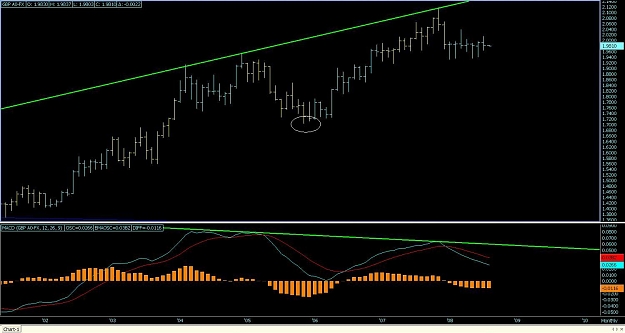
I'm still learning about this myself, here is a basic example of how I understand it works:
Attached Image (click to enlarge)
Price trend is bullish.
Trend line between the MACD crossovers is bearish.
Future minimum price target is located at lowest price between the MACD crossovers, in this case price area circled on the chart.
So at some point in the future, price will return to the level circled. However, it is mentioned that other issues can occur which may delay this return. It's also important to note that if the MACD lines cross the 'waterlevel', then the div becomes invalid. They have to be above/below the waterlevel. See post 4639 (http://www.forexfactory.com/showpost.php?p=3391283&postcount=4639)and 4640 (http://www.forexfactory.com/showpost.php?p=3391292&postcount=4640)for explanation.
Quote
Disliked
Can someone kindly point out in this example of USD/CHF 4hr if the div target is at the blue arrow or the red arrow (I think it's the blue)?
I can't see any real examples here. Can any of the more experianced guys see anything?
Quote
Disliked
And to clarify so I have it correct, when checking for these targets, it is usually the high/low extreme right before the divergence signal?
Your target will be the high or low price between the MACD crossovers. If any experianced MACD div gangsters can help us out with any further information to correct or add to this, we'd be most greatful.
I'm still learning about this myself, here is a basic example of how I understand it works:
Price trend is bullish.
Trend line between the MACD crossovers is bearish.
Future minimum price target is located at lowest price between the MACD crossovers, in this case price area circled on the chart.
So at some point in the future, price will return to the level circled. However, it is mentioned that other issues can occur which may delay this return. It's also important to note that if the MACD lines cross the 'waterlevel', then the div becomes...
Ignored
A possible #20.6 entry with the div support. To feel more comfortable check trend, timing, ADR.