questions - dp = ?
and would you be so kind as to explain why you waited for the 3rd ut to get in? (I'm thinking it's got something to do with this mysterious abbreviated dp
Thanks HG. Hadn't heard of Tom W's principle around entering short on ups and long on down bars. I might try filtering my entries with that idea in mind. Of course this would mean one misses those situations where the move happens straight after the upthrust or stopping volume.
Ignored
Yes and No.
Remember that the ideal or text book Up thrust IS an up bar and the ideal or text book Stopping volume bar IS a down bar. Yet I would still tend to look for the no demand after the up thrust or the test/no supply after the stopping volume.
The whole concept is a bit fuzzy. Look back at the up thrust at (I). This is your up bar (when weakness appears it appears on up bars). The entry method taught by Gavin is to place a short entry just below the low of the up thrust. The bar that brings you into the market is a down bar. So in one respect you are entering short on a down bar. But the signal to get short itself is on an up bar.
Wyckoff VSA: (1) Supply & Demand (2) Effort vs. Result (3) Cause & Effect
Here's a couple of charts with examples of immediate reactions to upthrusts (in contrast to moves that occur after confirmation by no demand bars or lack of interest in prices moving up following an upthrust).
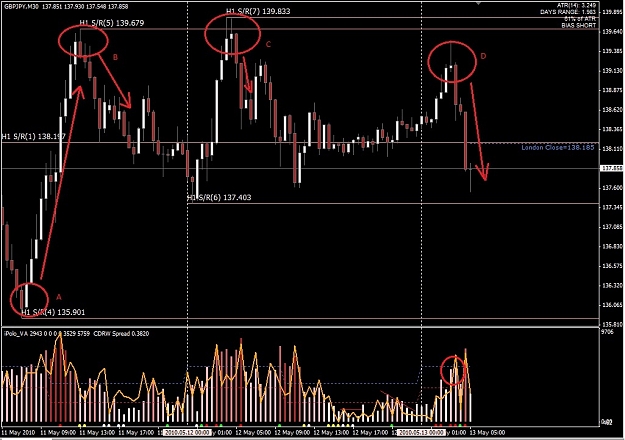
GJ-VSA-1
A and B look like 2 bar reversals with immediate moves after. C and D are upthrusts with D probably being a little better formed. I took the trade two bars after D (which is in my opinion, late, but that's when I saw it). But all the moves on the chart looked like reasonable VSA setups to me and all could have been profitable trades. The move after D didn't have any confirmation bars, no demand bars, lack of interest in higher prices etc, it just went - bam! I'm seeing this quite a bit. This is a little disconcerting if you are looking for confirmation as the move is happening right in front of you.
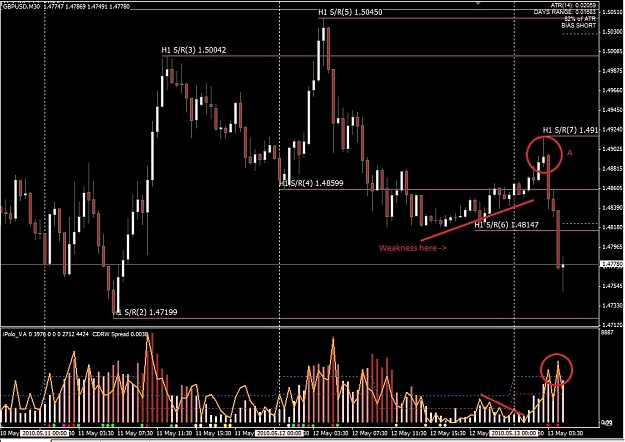
GU-VSA-2
has a similar kinds of move.
So it seems to me there are contrasting types of VSA setups here, ones where weakness (say indicated by a downtrend, then stopping volume) or strength (uptrend then upthrust) are followed by an immediate move, and then the other kind of situation where signs of weakness or strength are then followed by tests, or price drifting around on low volume until after a little more confirmation, or even several no demand bars or several upthrusts in a row, etc, before the real move occurs. Plenty of opportunity to get stopped out if you think you've seen enough confirmation to be in the trade.
How do people distinguish?
HG, I will try out using sell stops under the low of the upthrust, or buy stops above the stopping volume high (except for those huge down moves like last friday's EUR madness - I'll have to try something else there if I want to catch any of the up move on those!).
Malcomb - if you tell me all three upthrusts on the first chart were just building background weakness and confirmation I might just have to kill myself.
Thank you so much for the kind words. They really do mean a lot to me.
I need to let go of what Gavin said in his webinar. It just kind of hurt me. While he did not mention me by name, to say that this thread does not teach real VSA was a slap in the face......
Ignored
SORRY, I JUST HAD TO WRITE THIS
===========================
HiddenGap, Turn the other cheek and keep doing what you do. IT IS GREAT.
I'm a VSAclub member and have TG too. That's because I, as a lurker, followed Malc's and DrG's posts avidly over several years. I am grateful to Shamus for starting this thread; and continue to learn from posters such as you. I'm still learning and I try to gain exposure to the principles anywhere I can.
I'm sure if Gavin knew, he would acknowledge this thread for leading custom to TG and VSAclub. As for his comment, I guess he just wants to keep VSA pure (for obvious reasons).
It's only human nature to get fundamentalist and even sectarian. Now, let me see... Is this the thread of the "Shamus's Front for the Liberation of VSA" or the "Shamus' Popular VSA Party"? Of course, there are Wyckoffists who might suggest that Williamsites are heretics; and, no doubt, there will be others to come. BUT let's all unite, beat those SM devils, heed prophets, make profilts, and Fwee Wodger.
May the pips be with you
... and long live that high wranking wrapscallion, MalcolmB
... and pls come back DrG
Recently I have been vacillating between the use of VSA and Price Action as my way of using volume doesn't meet VSA criteria-I use one timeframe and a 5 minute timeframe at that. Anyway, I still drop in from time to time to see what’s up. I saw this as an interesting question and a way to "practice my skills". Therefore understand that this is all after the fact and its value is up to the individual reader.
There is a lot of weakness in this area. When weakness appears, it does not simply disappear one or two candles (bars) later. On to...
Ignored
hi HG, i'm paying allot of attention to your postings, your analyze of the charts is one off the best i ever seen. i don't know what gavin said in seminar ( can you send me a link with that?) but i think after you learn a think and you adapt this to your style, your needs that is proof of smartness and personality. so heads up, at least you got to be mentioned in a seminar, nobody mentioned me anywhere
k, now a quick question about where i got confused: KRB...previous your statement was " makes a lower low than previous candle, opens higher than the close of the previous candle and closes above both the previous close and its open" and in this post your definition is a little different, can you explain these? thanks
"Imagination is more important than knowledge" Einstein
esignal I use better volume indie , a volume profile / value area indie / murray mathlines , jma and rsx ( both by jurik)
Ignored
Where did you come across the first 3 Malcomb? I'm a price action kind of guy, but VSA is really piquing my interest. I bought the TradeGuide eSignal plugin, but it seems more like a crutch than actually reading the chart.
Every time you use 'hopium' in a post, God kills a kitten.
To be honest, as I see it, there is no difference when using volume and price action.
However the type of price action trading I was referring to is more the Japanese candlestick pattern (non volume based) trading type. But I wont go into that here.
I will make an observation of price action and vsa. Take a look at the chart I posted. I did not mention the fact that each up thrust (is making a lower high). That is a Price Action observation (Lower highs) and deals with market structure. But I think it is pretty important, if not basic,...
Ignored
Dude,
You are the master, I have print outs of your posts strewn madly all around the house. Its all gold and has helped me immensely... been a disciple since the first post.
Thanks, and keep it up. Good trading is good trading.
MM
Here's a couple of charts with examples of immediate reactions to upthrusts (in contrast to moves that occur after confirmation by no demand bars or lack of interest in prices moving up following an upthrust).
GJ-VSA-1
A and B look like 2 bar reversals with immediate moves after. C and D are upthrusts with D probably being a little better formed. I took the trade two bars after D (which is in my opinion, late, but that's when I saw it). But all the moves on the chart looked like reasonable VSA setups to me and all could have been profitable...
Ignored
Hi F451.
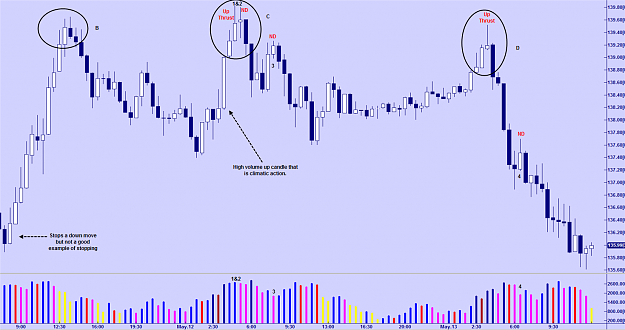
I have attached a chart of the GBP/JPY.
Before I get into that let me say that there will always be moves that are missed. It is a fool's game to try and catch every turn and every pip of a chart. You can narrow your focus a bit and you will still find that while there are missed moves, opportunity continually presents itself.
On to the chart:
The area you marked as A, I do not see as stopping volume. To be sure, it stops a down move, but I would not call that candle a true stopping volume candle. I could be wrong.
Area (B): Here we do not have a 2 bar up thrust. For a 2 bar up thrust you want to see the second bar close below the close of the first bar. Ideally, you would like the second bar to have more volume than the first, but that does not always happen. Could the second bar (candle) be a 1 bar up thrust? Well, it is Up thrust-like. True up thrusts come on UP bars. But that is not the real issue here. The real issue here is there is no weakness in the background to form the context of an Up thrust.
In other words, this really isn't a tradable up thrust. The background is not weak. We have not seen any climatic action up bars like a buying climax or end of a rising market or hidden selling potential. It is true that the market is rising on increasing volume and markets don't like up bars on high volume, but there hasn't been any climatic volume.
Area (C): The key to this area is the climatic up candle that comes before we get to the circled area. As I have stated before, the place to start is with a climatic action candle and or an excessively large volume candle. Notice that the next candle has increasing volume and a decreasing range. This is a squat. Something is putting pressure on price as it rises. That "something" is a large amount of sell orders from the BBs.
The next candle (1) has even more volume and is an Up Thrust. The close in in the middle of the range so we know this bar can't be bullish. With all that volume if it was bullish, then the close could not be in the middle of the range.
The next candle (2) is tricky. It is an up candle on volume less than the previous 2 candles with a range narrower than the previous candle. That is the definition of no demand. But the volume is still high. In fact this volume bar is higher than the volume bar on the climatic action candle and certainly higher than average. Simply, this is not the best amount of volume to see on a No Demand.
But it was there and some could take it, which disproves your point about this area. I, however, do not like it as much as (3). On (3) volume has dropped off and is lower than many of the previous candles including the climatic action candle that we start from.
Area (D): Wow. Beautiful. Weakness in the background a single candle up thrust on climatic volume. Tom has said he would enter here. Malcolmb would enter here. Note that this IS an up bar and the ideal type of Up Thrust. Also note that this Up Thrust makes a lower High than the previous Up Thrust.
The best place to short, according to Gavin, comes at (4). This is your No Demand after the up thrust and after the change in trend.
So (D) does not have to be missed in this case. If it is, opportunity presents itself anew at (4).
Attached Image (click to enlarge)
Wyckoff VSA: (1) Supply & Demand (2) Effort vs. Result (3) Cause & Effect
You are the master, I have print outs of your posts strewn madly all around the house. Its all gold and has helped me immensely... been a disciple since the first post.
Thanks, and keep it up. Good trading is good trading.
MM
Ignored
Thank you and thanks to everyone for the kind words. I truly wasn't fishing for them.
I think myself, Shamus and Mal all share one thing in common: we want every person that reads this thread and puts in the work to be as successful as any trader with TG or VSA club member out there. If I thought I was not moving traders in that direction, I would not post here.
Trading styles differ, but VSA unites. If some trader out there "gets it" and turns the corner to consistent profitability and I have played a small role in that, then I am humbled and honored. I am a pied piper of VSA because I am passionate about it. The last thing I would want to do is play my VSA tune only to have those that follow fall off a cliff due to my misunderstanding of the very principles I pipe about. (okay that sounded better in my head, but I'm going to keep it).
Just one more thing. I have learned much from many posters here myself. I consider myself a student not a teacher. Everyone please keep posting, asking questions, sharing insights, detailing successes and failures. That is how this VSA thread, nay, VSA community grows.
Wyckoff VSA: (1) Supply & Demand (2) Effort vs. Result (3) Cause & Effect
Before I get into that let me say that there will always be moves that are missed. It is a fool's game to try and catch every turn and every pip of a chart. You can narrow your focus a bit and you will still find that while there are missed moves, opportunity continually presents itself.
On to the chart:
The area you marked as A, I do not see as stopping volume. To be sure, it stops a down move, but I would not call that candle a true stopping volume candle. I could be wrong.
Area (B): Here...
Ignored
Thank you for the detailed analysis. It's really appreciated. It looks like I need to work harder at identifying the background to distinguish weakness and strength. More practice
I assume none of the upbars before the top at B qualify as climatic because even though large volume, it's not relatively large? Or it is more because of the lack of reduced spread (indicating selling into the rise)?
.....now a quick question about where i got confused: KRB...previous your statement was " makes a lower low than previous candle, opens higher than the close of the previous candle and closes above both the previous close and its open" and in this post your definition is a little different, can you explain these? thanks
Ignored
I may have made a mistake. For a KRB, it should be opens lower than the previous close and makes a lower low. It should also close higher than it opens and close higher than the previous close. And lastly, its even better if it closes slightly off its high.
BTW thank you for the nice remarks I appreciate them.
Wyckoff VSA: (1) Supply & Demand (2) Effort vs. Result (3) Cause & Effect
Nice charts man... do you post this stuff real time? Or after the fact analysis. Im asking cos i dont know... not cos im trying to be patronising.
Thanks
MM
Ignored
Ari
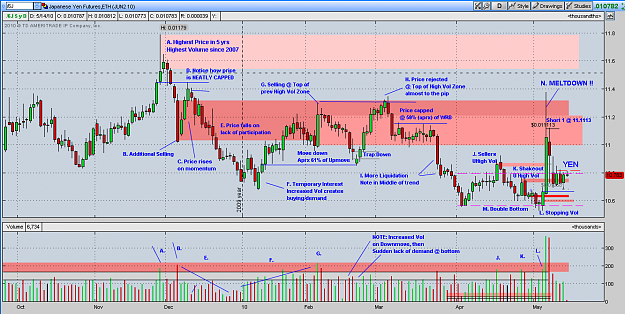
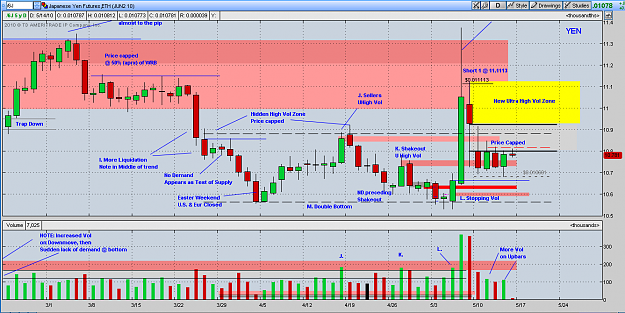
That is a current trade, i was a little too confident last nite, (i need to learn to be more humble) it retraced quite a bit, but looks like it will come back down. Counting on the struggle between BOJ and the BB's, makes for some nice ranges.
I constantly look at my charts. As I go back over them and see how things have unfolded, i will mark them up for reference. I did add some comments for the posting in order to better express a few things that occurred to me... hoping it will help someone better understand the background and movements.
Admitedly, the meltdown last week was a rare occurrence, understanding that for every seller there is a buyer who is going to want to get their money back.. i just couldn't pass it up... (guess i'm an addict, at least that's what my wife says! )
![Click to Enlarge
Name: 2010-05013gh[1].png
Size: 86 KB](/attachment/image/474771/thumbnail?d=1365626182)