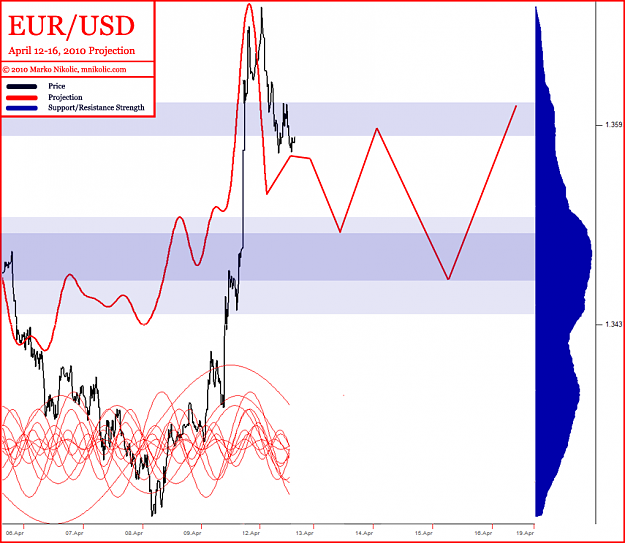
Expecting a bit of ping-ponging between 1.36 and 1.34.
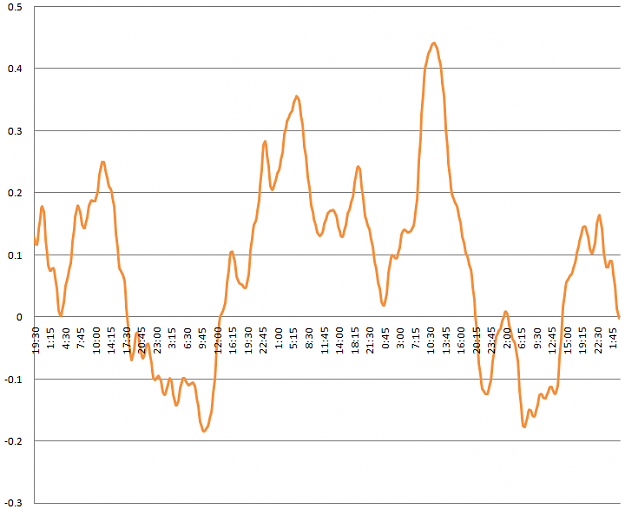
The projection is pretty self-explanatory. Red is the composite and projected wave, with relevant frequency decomposition in the bottom. Blue are the strong support/resistance zones and black, the price (ahem, in LINE form).
I will also post a few other graphs over the next little bit, which will give you further insight into my scientific method.
As a general rule of thumb, direction should always be considered before projection amplitude. Therefore, pay attention to turning points first, segment direction second, and finally the areas of support/resistance that are likely to cushion market momentum.
Attached Image (click to enlarge)