A thought-provoking concept you have developed.. thanks!
I would like to ask if your number counting ever resets to zero - technically, we could have very large numbers if we use hourly bars and have been in an up/downtrend for weeks.
Ignored
It's my understanding from his replies to my postings, that he only uses the last most recent counts, this may result in a number above 100 (or +99) as he puts it in a very strong up trend, but then if a swing/retracment follows (as they typically do) we would be out of the trade until after a few swings, this would then create the balance of numbers naturally and would either lead us in the new direction or allow us to continue the original path.
possible not the clearest of answers, but thats kinda the way i'm seeing this, and if you apply the indy, then follow a count one candle at a time, you'll see how it developes.
hope this helps - and well both find out if i'm right or wrong later
Bingo! I'm always most concerned with trying to figure out the trend right NOW. So I'm always looking at the last number in either direction (or, in the case of zeros, the last couple of numbers).
I guess that was kinda my point in my first couple of posts. Sometimes I get frustrated by people who see a big high on the beginning of their chart and a big dip in the middle of the chart and they declare that the trend is down. But they conveniently ignore the huge retracement at the end of the chart (in other words, the retracement happening right NOW). At what point does that retracement become a true reversal? How long should it be ignored or even traded against? When I was trying to answer that question, I started counting these gaps.
I was trying to answer this question: "OK, so we are seeing an up-bar. Then how long has it been since the high in this up-bar has been achieved?" Then I just started writing the numbers on the chart.
A thought-provoking concept you have developed.. thanks!
I would like to ask if your number counting ever resets to zero - technically, we could have very large numbers if we use hourly bars and have been in an up/downtrend for weeks.
Ignored
The indicator D3trax so graciously provided does a great job of handling this. It only looks at the last 1,000 bars, so the highest count you can get in either direction is 999.
If that sounds flawed or limiting, it's not. There's really no point to go back any further than that (technically speaking, the current high/low could be SO high/low that it is the highest/lowest the pair has EVER been, which would lead to ridiculously high numbers).
Once the high/low count gets into the hundreds, it's really enough to know that the high/low is climbing to an extreme level. Because when that happens, the opposite count will invariably be much smaller. It's not really practical to think that you will have a 999 count on the high and the low. If your high count is 999 (or any very high number) then your low count is probably 0 or 2 or 5 or some other relatively low number.
I was trying to answer this question: "OK, so we are seeing an up-bar. Then how long has it been since the high in this up-bar has been achieved?" Then I just started writing the numbers on the chart.
Ignored
so did the smarter you ask the question? or answer it? lol
|
Joined Apr 2007
|
Status: Burning pips since 2007...
|340 Posts
I'm not sure if this helps anyone or if it's just further babble, but another way to think about this counting method is that it quantifies support and resistance levels. I believe very much in s/r levels, but I don't use them much in my trading because I'm a quant and it always bugs me the way guys just draw lines on their charts like it was art. I want something that I can put a number on that has nothing to do with my "eye" or my interpretation.
When a pair is trending (let's just use "up" for illustration) then the highs of the up bars tend to break into ever higher territory. This happens because they keep breaking through new resistance levels. However, the down bars tend to have lows that aren't any lower than the last couple of bars before them. This happens because the support levels underlying the pair keep rising.
When I'm trying to spot a reversal (versus a temporary retracement), one of the key things I'm looking for is the strength of the down bars in that reversal. If the down bars have very weak lows, then the down bar in general is probably just a blip on an otherwise-upward march. They may be down bars, but they are very weak bars. But if the down bars start to break ground on ever-lower lows that haven't been seen on the chart for a while, then a true reversal might be forming.
If we assume that the pair you're following is currently in an uptrend, then you must see two things on the chart before you can start to think it's a true reversal:
A weak up bar
At least one strong down bar
If you have a strong down bar but you haven't seen any weak up bars, then I think there's a strong chance that the uptrend continues. If the up bars start to weaken (their counts get smaller) but the down bars stay weak as well, then it is very possible that the pair is "idling" while it waits for the next breakout.
so did the smarter you ask the question? or answer it? lol
Ignored
Usually those "conversations" are accompanied by a healthy dose of beer or Captain Morgan's. When I stop asking myself questions and I start arguing with myself, I turn off the charts.
It can easily be used as a mechanical system(not perfect but still very good), for exsample on daily chart, I made some tests,-
From 2008 til 2009 it gives about 1076 pips
From 2009 til today it gives about 1942 pips
It is not any magic but it is profitable. I tested eur/usd .
It can easily be used as a mechanical system(not perfect but still very good), for exsample on daily chart, I made some tests,-
From 2008 til 2009 it gives about 1076 pips
From 2009 til today it gives about 1942 pips
It is not any magic but it is profitable. I tested eur/usd .
Ignored
Naw, it won't really be a system until we stick 5 or 6 more indicators on the screen. And we need an e-book. And then we need 14 different versions of an EA - all of which are sworn to work (especially in backtesting) until you put them on a live account and they drain your account with erroneous orders. THEN we would have a system!
It can easily be used as a mechanical system(not perfect but still very good), for exsample on daily chart, I made some tests,-
From 2008 til 2009 it gives about 1076 pips
From 2009 til today it gives about 1942 pips
It is not any magic but it is profitable. I tested eur/usd .
Ignored
Sarcasm aside, the EA that I'm testing uses successive signals to layer into (some would say, pile onto) a trade as the trend continues. In early testing this seems to have some very beneficial results. Of course, any time you start piling more lots onto an open position, it tends to amplify the results (for better or worse), but the "feathering-in" approach seems to amplify the wins and minimize the effect of the whipsaws.
Sure it is not a system yet, just it has a huge potencial if just to add some other rules or indicators. Only not to complicate it too much.
I am testing a little bit more. I take a signal on daily chart and use jumping stop of 100 pips on hourly chart for better view. It seems to work even better.Will see.
@d3trax: do you think you are able to implement an alert when a determined difference between the uptrend and downtrend numbers occurs? it would be really good if there are arrows printed (like bytebodger did manually) when for example, downtrend is 12 and uptrend is 2. i would like to try that with a m5-chart and maybe with an rsi for additional confirmation.
talking about mtf... another idea would be to let the indicator run in a larger timeframe (m30, h1) and if a difference of 6-8 occurs, just switch down to m1 chart and look for the first useful 123-setup. an ema-crossover in a low timeframe could also be interesting.
the main idea is to use bytebodgers "trendcounter" as a filter in larger timeframes and then look for an entry in a small timeframe.
i recommend not to use h4 or higher because the h1 chart is the largest timeframe where the charts are equal in all time-zones of the world.
bytebodger, again i must say that your idea is really great. i don't know if it works for me but i will definitely try. i agree with you that methods which need a large portion of interpretation are not my preferred thing. it's very hard to get more confidence and increase lots then...
Joined Jan 2007
|
Status: developing...
|974 Posts
Hi Bytebodger,
I can confirm a couple of your observations after working up a model patterned after your descriptions. First, if taken as a standalone strategy the longer time frames do work better (hour+, longer tickframes, longer rangeframes etc). I figure this is the case because the basic concept has to do with one side overtaking the other. The sell side overtakes the buy side or vice versa. When this happens, it's typically a breakout type of move. Time or activity also are factored into this pseudo breakout concept. And because breakout type moves require price movement as a trigger, short term swings (which are by definition short-lived) tend to not show the necessary follow through to provide profits large enough to offset the later entries from a breakout type of setup.
Next, on those longer timeframes, having a larger up vs. down count disparity does make the signal more powerful / profitable and cuts down on some whipsaw type trades. Also, there is a limit to how long term you can go with the concept because there comes a point at which entries are too late to catch the meat of the move. Finally, because it is a breakout type strategy / concept, entries tend to be buying into strength and selling into weakness. When you get V bottoms and inverse V tops, the strategy has a difficult time switching position because the opposing count will be highest at these extremes and unless there is some type of small pullback at the start of the new trend, there will be no timely reversal signal. So I would classify it as a breakout type strategy with an opposite pullback requirement in order to trigger a timely reversal (emphasis on timely).
While there is no hard and fast exit/go flat rule built into the strategy as it is more suited toward a SAR type of setup, it appears that the general concept of the high/low count and comparison can be applied to other things than the close, high and low prices .
Just finished your thread & it is outstanding along with being most simplistic. You are on to something that is most thought provoking.
What about the 15M & 30M tf's?
Thanks & keep sharing your thought provoking information.
Ignored
Please see FXEZ's excellent post just above this. He basically outlines the "problem" with this method on the 15M/30M (or below) TFs.
I developed an EA that uses these counts to trigger trades and I set the EA on demo trades starting last week. I put it on 15M, 1H, and 4H charts. Although one week of demo results proves absolutely nothing, I will tell you that to this point the 15M charts were getting killed, while the 1H and 4H charts are solidly profitable. In fact, the 15M charts were getting killed so bad that I just turned off the EA on those charts altogether.
That being said, I firmly believe that this counting method has at least some informational value/validity on ALL TFs. But I definitely would NOT use this method alone to trigger trading decisions on the lower TFs.
I think this makes sense because I created this counting system as a different (hopefully, better) version of an MA cross. Although it's not wildly profitable, I can show you how consistently trading MA crosses on large TFs can, over the long haul, make money. I can also show you how trading (nothing but) MA crosses on the lower TFs will get you killed.
Next, on those longer timeframes, having a larger up vs. down count disparity does make the signal more powerful / profitable and cuts down on some whipsaw type trades.
Ignored
That is definitely interesting feedback that I'll need to investigate. In some of my comments in this thread, I've alluded to the fact that some count switches are clearly weaker than others, but in the EA I'm testing, I just set it to take all switches in the count. Of course, it's somewhat logical that a larger disparity in the count should constitute a stronger signal, but I actually haven't spent any time testing that yet.
Finally, because it is a breakout type strategy / concept, entries tend to be buying into strength and selling into weakness. When you get V bottoms and inverse V tops, the strategy has a difficult time switching position because the opposing count will be highest at these extremes and unless there is some type of small pullback at the start of the new trend, there will be no timely reversal signal. So I would classify it as a breakout type strategy with an opposite pullback requirement in order to trigger a timely reversal (emphasis on timely)....
Ignored
Absolutely.
With regard to triggers, it's key strength can, of course, at times be a key weakness. The strength is that it does not trigger a reversal until it has seen a weak signal from the prevailing trend. Of course, in some severe reversals, there is no weak signal. Sometimes the price action just takes off in the opposite direction like a jackrabbit. In those instances, this method suffers because it keeps waiting to see a weak signal from the previously-prevailing trend before it signals a reversal.
Then again, there are times when this is a thing of beauty. As I showed in my example on the USDJPY at the beginning of this thread, there are times when this counting method will not be "fooled" by a significant retracement.
|
Joined Apr 2007
|
Status: Burning pips since 2007...
|340 Posts
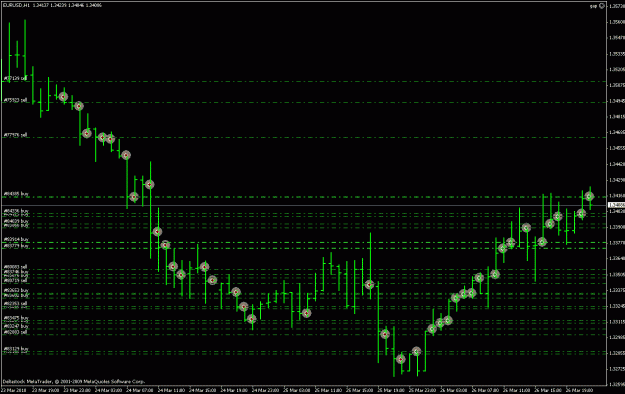
This snapshot illustrates what FXEZ was talking about when he said that this method buys into strength and sells into weakness. I developed an EA roughly based on these rules and I'm running it on 5 or 6 different pairs. Certainly, all of the charts are not as pretty as this one. Admittedly, this chart shows the best-case scenario for this method.
As you can probably guess, every red arrow represents a sell order and every green arrow represents a buy order. What I'm most interested in is the presence of the two minor upward bumps right in the middle of the chart. Notice that the counting rules never lead to an official reversal. The EA just sits on those minor retracements and, after they're done, it continues placing sell orders. It's not until the second half of the chart - until the absolute nadir of the "V" - that the count reverses itself and the EA starts placing buy orders.