DislikedSet up your charts on the Daily. The trend is down
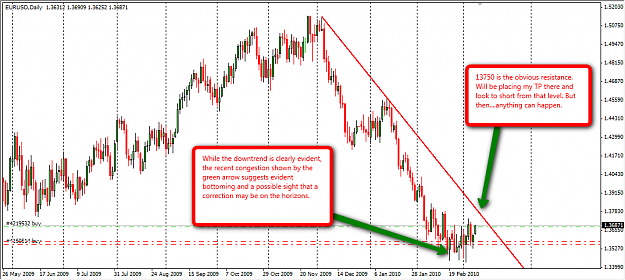
Draw a line connecting up the highs from 5109 and 4579. See the line? That is your resistance line.
The euro is attempting to get to that resistance line. When it does, the system says sell.
If you are buying on the hope that the Euro is going to get to the line, you are trading counter trend.
Other jacko members can add to this.Ignored
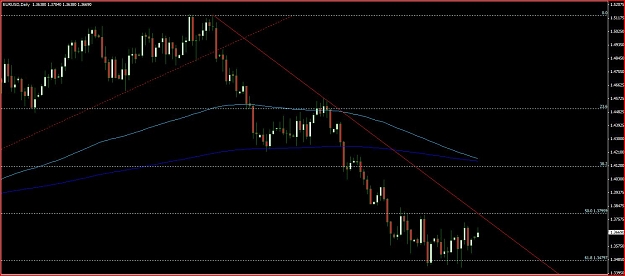
Although , i would like to expand a bit my previous post. I dont have my trading platform in front of me, so I will be using online charts, so excuse me if there are some deviations. I have my trendline placed as Rastaman said (from 03.12.2009 - 1.5140). Now this trendline, gives a possible retrace on the daily, somewhere between 1.38-1.37 depending on how many bars are going to be needed (time) to get there.
Anyway, currently i am more worried about the weekly chart. Roughly said, this downward movement that started at 03.12.2009 is 11 weeks long. Now the last 3-4 weeks we have seen indecisive PA. Now provided that we see a retrace signal on the weekly , this means big movement on the daily, and if we assume that retraces take between 1/3 and 2/3 of previous move (looking at the weekly), i thing that this daily trendline would not be of much problem. In this case the 50% fib would be around 1.4.
So thats why i will use the greatest instrument of this system - patience. I would like to get a more clearer signal on the weekly.
I have mentioned the word "assume" some lines ago - as it was said in one movie - "assume nothing, because it will make an ass of u and me". Meaning that i could be wrong.
Thanks everyone and I wish you (i am sure) that we are all going to have a nice trading week.