Hi guys,
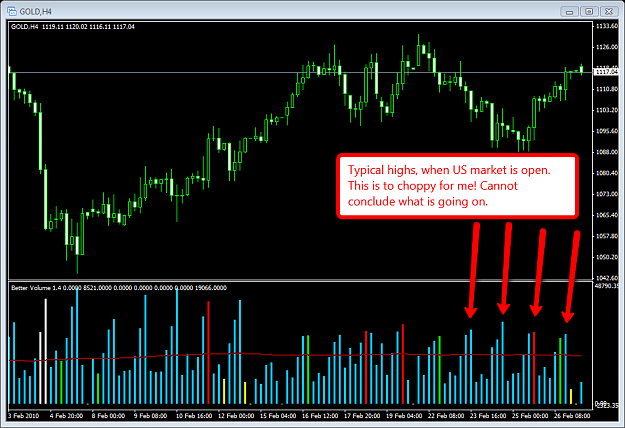
I use VSA trading for the daily chart but always have problems when I go down to the H4 or H1 cart since the market activity is very fluctuating. Typically it is high when the us Market is open and low in the Asian session.
But how can I conclude what is going on? This is confusion me since it is routine that the market is at these times active or not active.
Do you compare the candles with the candles from the day before?
Regards,
Centaure
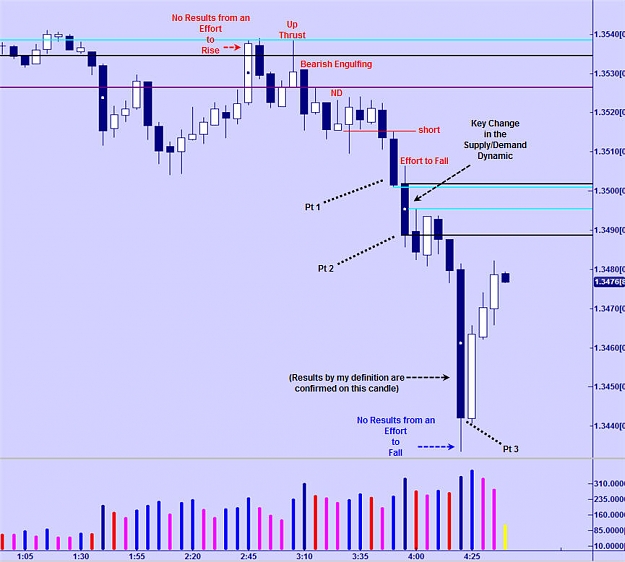
Attached Image (click to enlarge)