Have you always used old trend lines that have been violated on both sides? Can you explain to me why you use those?
Ignored
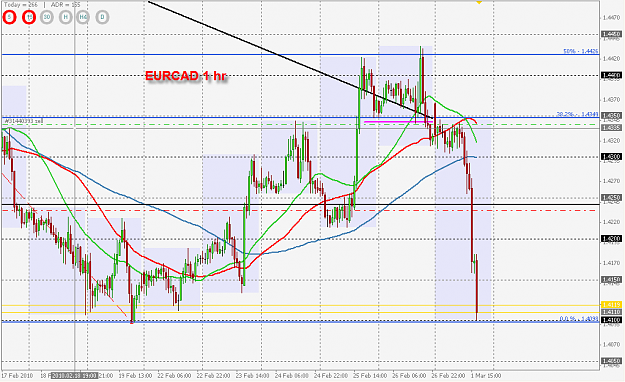
No, never used them before. But if you watched my previous posts, I experiment with diagonal S/R levels right now as well, and seems to work up till now. My assumption is that obvious diagonal S/R levels will also be noticed by market players. Obviously I only want them with confluence of horizontal S/R and fib levels.
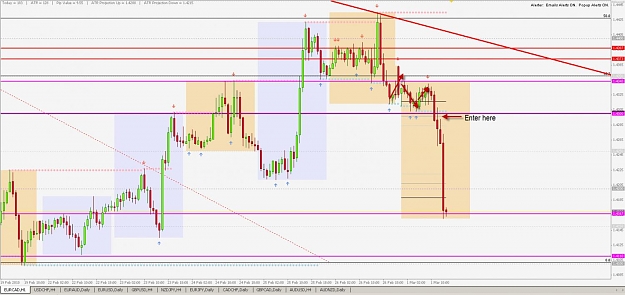
I entered this one a little more agrresive than I usually do, I entered right at the retest and failure of the consolidation channel. I used the 1 hour chart as my trigger.
No, never used them before. But if you watched my previous posts, I experiment with diagonal S/R levels right now as well, and seems to work up till now. My assumption is that obvious diagonal S/R levels will also be noticed by market players. Obviously I only want them with confluence of horizontal S/R and fib levels.
best regards
Ignored
That's very interesting. Thanks for the explanation.
I was using MIG too and I had the same problem, it is happening is your getting bad data, you will need to go in an change the data. Mine was showing a 6000 pip move on the weekly chart and a couple different pairs, I had too change it manually.
For some reason MIG does does that and seems like quite a bit.
--NM
Ignored
Another suggestion I received was to clear out the history folder. That fixed the weekly but not the monthly. The data file for the monthly is 1/3 the size of the working charts. So it's either bad data or not enough.
I entered this one a little more agrresive than I usually do, I entered right at the retest and failure of the consolidation channel. I used the 1 hour chart as my trigger.
--NM
Ignored
It looks like the 1-2-3 off the resistance around 1.4343 gave a nice conservative entry just below the RN 1.4300.
One of the setups I am watching is nzd/jpy h4 chart. Wanna go short at the confluence level.
You got anything coming up?
Ignored
Hi Custos, fib value question: I see next to your % you display the price value too - my attempts to get it displayed failed. Can you give me some instructions as to how to go about it...
Hi Custos, fib value question: I see next to your % you display the price value too - my attempts to get it displayed failed. Can you give me some instructions as to how to go about it...
thanks
Ignored
yeah, that is kind of tricky.
for 38.2% fib. you need to type in "38.2%%", if you want the price value too you just type in %$, then price will automatically be displayed. So all in all, on 38.2 fib I typed in: "38.2%% - %$"
yeah, that is kind of tricky.
for 38.2% fib. you need to type in "38.2%%", if you want the price value too you just type in %$, then price will automatically be displayed. So all in all, on 38.2 fib I typed in: "38.2%% - %$"
Does that make sense?
Ignored
My live trading platform will not allow me to do that, I can only go one way with the fib extensions, I have to draw them upside down to get the target extensions...Hahaha
Another suggestion I received was to clear out the history folder. That fixed the weekly but not the monthly. The data file for the monthly is 1/3 the size of the working charts. So it's either bad data or not enough.
yeah, that is kind of tricky.
for 38.2% fib. you need to type in "38.2%%", if you want the price value too you just type in %$, then price will automatically be displayed. So all in all, on 38.2 fib I typed in: "38.2%% - %$"
Does that make sense?
Ignored
thanks Custos,
i was wondering how to get those numbers in too.
cheers
yeah, that is kind of tricky.
for 38.2% fib. you need to type in "38.2%%", if you want the price value too you just type in %$, then price will automatically be displayed. So all in all, on 38.2 fib I typed in: "38.2%% - %$"