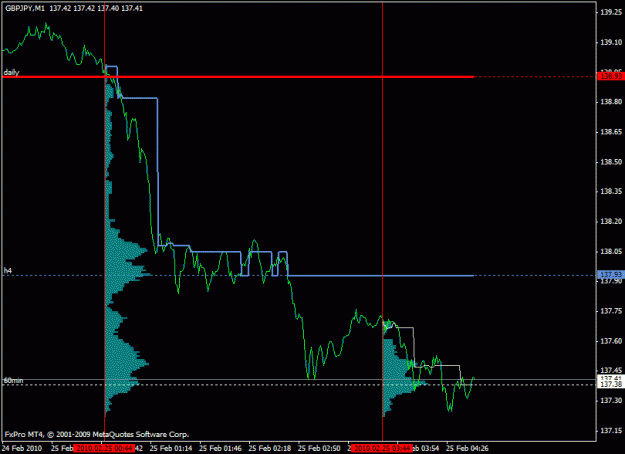
there is only one indicator, applied several times to the same chart - market_statistics_v5.0.
i am interested in tick histogram and value of pvp (peak volume price = price where most ticks occurred during a certain period of time), and this is what you see on my chart: histograms and pvps.
the indicator also shows vwap and standard deviations of vwap... well... there is a thread on tsd forum if you want more info about these indicators...
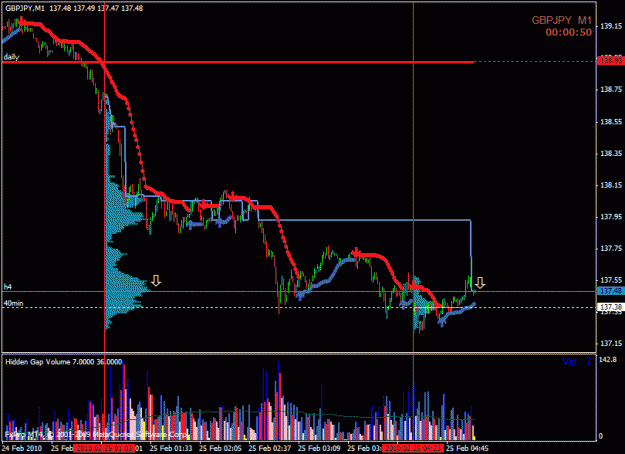
DislikedWhat indicators are those scrat, what exactly do the lines represent?Ignored
Attached File(s)
Nihil Sine Deo.