DislikedI am very interested to know what your thoughts are on those charts Chief, what does it look like to you....
My honest opinion is that it looks like accumulation....Ignored
Some general thoughts on VSA....
WARNING: - I'M OFF MY MEDS !
(I'm not responsible for anything I say or do.)
(What follows are my own irrational rantings)
Tom Williams mentions price reactions to areas of previous support and resistance, and other good traders on here have mentioned price reaction to previous areas of high volume also. I have found a lot of validity in the idea and tried to develop a way to utilize it in my trading.
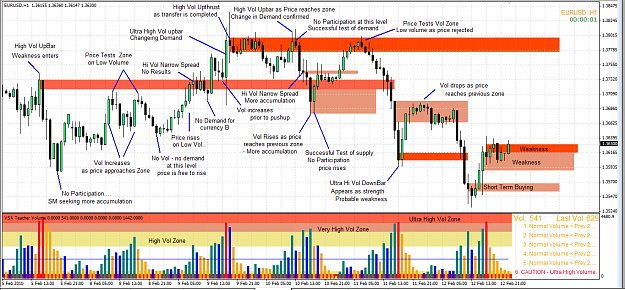
I look at things a little differently, so I atttached a chart which may help to understand how I use the idea of Volume Zones.
One of the best things I ever saw on this subject was in another forum, where someone said.."price CREATES volume". Sounded pretty obvious when I read it, but it's a concept I overlooked in my efforts to learn a new way of looking at the market. (and like a lot of others, I was busy sweating over the meaning of each and every blip and bar!)
Obviously true, if the price is attractive people will buy........ if it's not they won't. I keep this in the front of my thinking as I look at each bar... then each zone...."How attractive is this price ?" When I see a lot of volume I know the price is very attractive. The question that follows is..... why?
The price is attractive for only a couple of reasons.... Big Banks see a profit by changing the direction, or they see a profit by continuing in the same direction. In each case they signal their intent through their buying which creates volume or lack of buying which creates no volume and that helps answer the question of why the price is attractive.
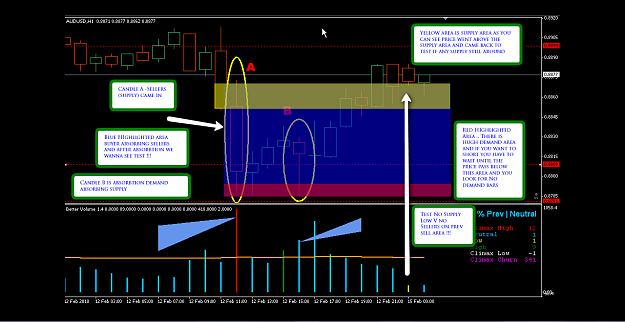
In this Forex there is no Supply...... only Demand. There is only demand for currency A or currency B. When there is a high demand for currency A, there is a low demand for currency B.
So I view the idea of Supply and Demand as simply which side is the demand on... side A or side B? This helped to clear up the conundrum of a 2 sided trade with an infinite supply that was just being swapped back and forth between banks.
This brought about the idea of testing the demand where I began to view each individual bar as a test of the demand. Whether that test is successful or not depends on the results. If the price continues in the same direction.... then it is a success. If it doesn't.... then its a failure. Volume or lack of it simply shows the degree of success.
When we see a High Vol Upbar, we say weakness is entering... true. I however, view it as a sign that Demand for currency A is weakening. If it is followed by a Low Vol bar I can say that demand for currency A has dropped and consider it a failed test of demand for currency A. The most important part.... it also signals a new level of demand for currency B.
The same thing applies at the bottom of a trend, only the demand has reversed itself... the demand for currency A is increasing while the demand for currency B is weakening.
This is all applied to volume zones as they are an indication of the degree of attractiveness that a particular price has. When price returns to a volume zone we can expect a reaction of some kind.
If the price returns to a high volume zone and then bounces off and returns to it's previous direction, this tells us the market views this price as un-attractive because they have their money tied up at this level and they can only make a profit when the price moves away. They may, however, use these bounces to add to their positions, but they dont want the price to remain at that zone level.
If the price trades right thru a volume zone, it is a good indication the market makers have changed sides and the demand is now with the opposite currency. For the most part we recieve advance warning of this by the increased volume or the complete lack of volume at a different level.
In short, I use the volume zones as flags to visually show me where the interest, or demand, lies in the market... and what the intent of the market makers is.
Another aspect of the financial market I keep in mind is 'Rapidity'. The faster the money is turned over, the more money is made. Banks do not like to let their money sit idly, they like to keep it moving making a profit on each move. The more moves they make, the more profit they stand to make, so they wont let things stand still very long.
And finally, the last thing I try to keep in mind is the Forex market is a worldwide globally connected market, and all the big banks have offices all over the world. Each bank has a strategy, which is communicated to and implemented by ALL their offices. A move may be started in London, then continued by the office in New York, and completed by the office in Tokyo. So what happens in one trading session has a direct bearing on what happens in the next.
Hopefully, the chart that is attached will illustrate some of these ideas. I realize these ideas may be a bit off the wall but I hope this is of help to some of the traders out there... but dont hold me to it.... I could be completely, irreversibly insane...
Sincerely,
Chief