DislikedHi Castlebrook,
From your query to MissPips it seems you are watching M5 charts and when the conditions are met you are going back to M1 chart for a good entry. Is my understanding correct ? If it is then do you watch the trade on the M1 chart or M5 chart for the exit till you hit the target pips or stop loss?
Cheers
NoviceIgnored
Firstly yes, I get a heads up on the 5 min chart and then go to the 1 min for entry. Here's the procedure with an example...
TIS Execution Procedure
The pre-session routine is done and the intra-day routine is in effect as detailed in the Trading Plan. (See my earlier posts) In particular note the trend on the 15 min and 1 hr charts. Trading with the trend is preferable. Also note whether or not there is enough ADR left in the direction you intend to trade.
Trading Long
1. Monitor the 5 min chart. The heads up is the 5 min IC histo turning green (top Histo). (This is what I need the alert for)
2. Next look at where price is in relation to the 20 sma. Is it above or below? Price above the 20 sma is better/less risky when the trade is taken. Are the 20 sma and Coral lined up correctly? For a long the 20 sma should be above the Coral when the trade is taken.
3. Now move to the 1 min chart. “Stalk” the price action and only take a long trade when the (Ichimoku Cloud (IC) and price is above the Coral. Looking at the 1 min chart price must be above the Coral and both top IC histos must be green when you trade.
4. Both the 1 min fast and slow Trix must cross each other and both be green. (Best and most secure trend confirmation is when the fast Trix crosses above the zero level).
5. If the 1 min fast Trix is overbought wait for the next wave when the fast Trix turns green again.
6. On the 1 min chart you can see the 5 min Trix. Safest long trades are when at least one (usually the fast trix) is green. Ideally both are green.
7. All the time monitor the 5 min chart to see if the price is above the 20 sma . (Also the safest trade is when the second Histo, the 15 min Histo has turned green so both Histos are green.)
8. If more than 10 pips to resistance take the trade long. Again this is not an absolute rule but most conservative.
9. Place a stop loss as detailed in the plan, ideally below the last 5 min Swing Low if not too far away and is within your money management rules.
10. Exits can be a flat 10 pips, Sweet Spots, trendlines, pivot points or other support and resistance. It is also possible to scale out with 50 % at the first target and 50% at T2, whilst bringing the stop closer to breakeven. Please read the section on ADR.
Trading Short
Exactly the opposite but change up for down, long for short, below for above, green for red etc...
More aggressive trades can be taken (going for only 10 pips) by ignoring points 2, 6 and 8. In other words you’re not concerned with where price is in relation to the 20 sma; you’re not concerned about the colour of the 5 min Trix and you are not concerned about trading into support or resistance.
Trade example (Short)
EUR/JPY
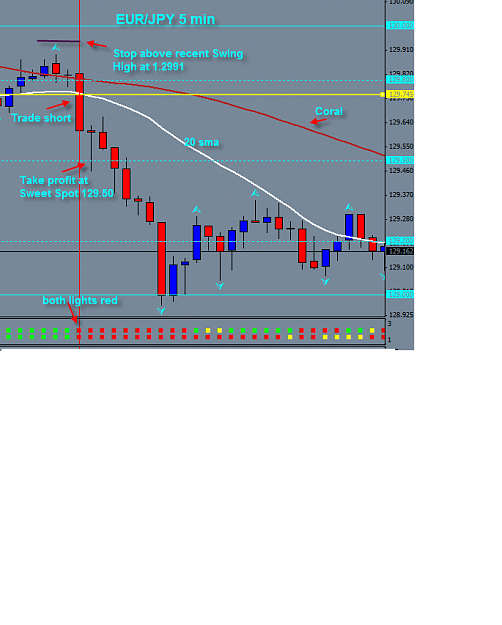
1. Downtrend. (Not shown) Heads up on 5 min chart when the 5 min IC Histo turns red at 0700 hrs. (They both turn red at the same time which is better)
2. Price is moving below the 20 sma and the 20 sma is below the Coral which is good for a short.
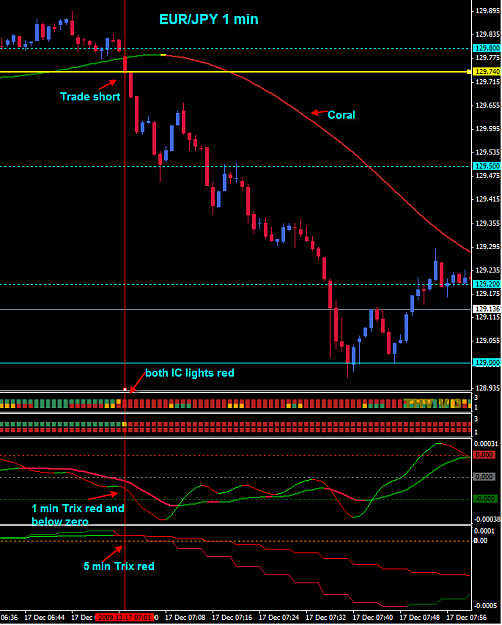
3.Looking at the 1 min chart (below) price falls below the Coral and both top IC histo lights are red. (0701 hrs
4. Both the 1 min fast and slow Trix have crossed each other and both are red. (Also fast trix crossed Zero line)
5. 1 min fast Trix not oversold.
6. Both 5 min fast and slow Trix are red.
7. Back to the 5 min chart, the price is below the 20 sma . Both IC histos on 5 min chart are red which is good.
8. There are more than 10 pips to support so the trade is taken short at 129.74.
9. A Stop Loss is placed above the Swing High at 129.91 (total 17 pips which is good).
10. A limit order is placed at the Sweet Spot 129.50 to exit the trade. Please note if you are purely scalping for 10 pips then you’d exit at 10 pips profit.
Just try a few examples for yourself. This seems long winded but with practice you look for these 10 points almost by instinct and it takes SECONDS. Don't forget after the heads up on the 5 min chart you may have to wait for the price to cross the Coral on the 1 min chart.
Attached Image(s) (click to enlarge)