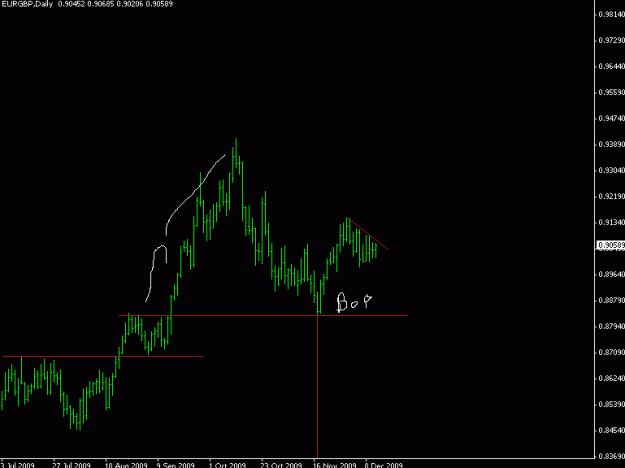
I ploted some lines that appear important to me. Does it makes sense?
Anyone else who like to give his/her opinion just share it I´m glad about any help.
Ignored
You've plotted s.r based on previous cluster from daily which is good approach. As a secondary measure, see if any of those levels matches with s.r on a weekly.
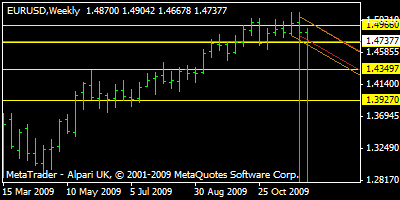
Im thinking.... Price fell vertically from 50x. Now we are in diagonal movement which continues the momentum. Breakouts are south. So for the time being shorts have favour.
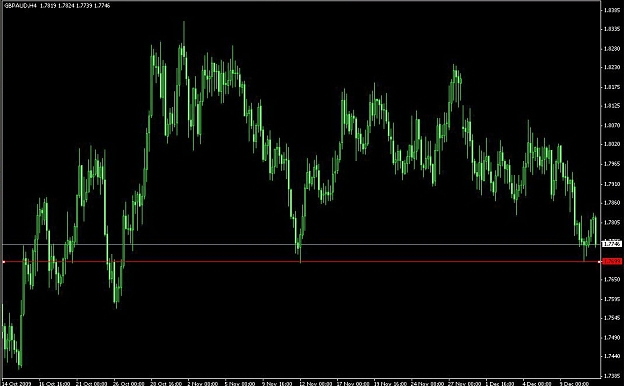
We,re currently at support, horizontal and channel, so i dont want to be selling here. If pa confirms i could take a contrarian long (current price 14710) and favourable short 4850-4900.
You've plotted s.r based on previous cluster from daily which is good approach. As a secondary measure, see if any of those levels matches with s.r on a weekly.
Im thinking.... Price fell vertically from 50x. Now we are in diagonal movement which continues the momentum. Breakouts are south. So for the time being shorts have favour.
We,re currently at support, horizontal and channel, so i dont want to be selling here. If pa confirms i could take a contrarian long (current price 14710) and favourable short 4850-4900.
I'll look to invest in...
Ignored
Appreciate your insight on this one.
You say "...any of those levels match in the weekly.." Which are the best ones ? Diagonal or horizontal ? Can we speak about "priority" when talking about lines?
And last but not least: "...Breakouts are south. So for the time being shorts have favour." Should I plot the downward lines too?
You´re being a great help to me in matter understanding market behaviour.
nice to see u around
we are approaching the area where i will be looking for a buy .
regards
samer
Ignored
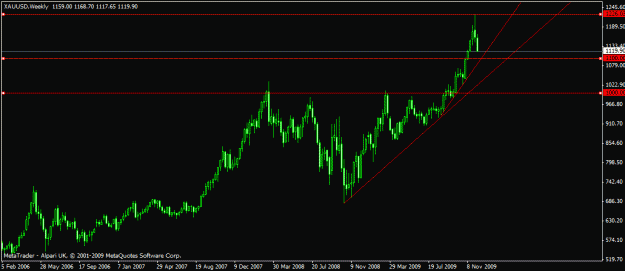
i can see why you've marked 1100, could be good if you could find a secondary support.
i see 970 as investment zone.
general formation is same as your seeing on eu. vertical followed by diagonal.
sometimes the diagonal part equals or just exceeds the vertical part before finding reasonable support (this is my twist on harmonics). wondering if it will hold true.
You say "...any of those levels match in the weekly.." Which are the best ones ? Diagonal or horizontal ? Can we speak about "priority" when talking about lines?
And last but not least: "...Breakouts are south. So for the time being shorts have favour." Should I plot the downward lines too?
You´re being a great help to me in matter understanding market behaviour.
Ignored
Orthadoxy would give priority to the horizontal. This is because its easier to spot and plot. So accuracy rate for correctly identifying is higher.
Dynamic sr has many different techniques for drawing. My approach is to use 2 extreme points for the line. Then copy this line and 'force fit' it on to the pa. If it doesn't fit i dont have a channel.
Then when prices approaches, you can work out the significance of the level by seeing how price reacts to it.
For weekly my meaning was to take horizontal s.r from weekly.
I don´t know how to change the old PDF in my previous post so I post it updated here.
I´ll appreciate if someone can show me how to upload it in this post again once it has being updated the next time.
Thanx.
i don´t know how to change the old pdf in my previous post so i post it updated here.
I´ll appreciate if someone can show me how to upload it in this post again once it has being updated the next time.
Thanx.
Ignored
thx u for the time /the pdf file will really help me out in my trading!!!
Sure I'll respond, get a clue. Price action is what moves the market. S&R will allow you to profit, have fun with your BS indicators.
Peace out and get lost
Ignored
"Price action is what moves the market"
Hedge Funds and Banks is what moves the markets.
"S&R will allow you to profit"
S&R can be found by generating random prices in an excel spreadsheet. Do you really believe this is what big players look at to make their decisions? Your fooling yourslef or your just a plain fool.
"have fun with your BS indicators"
Whoever said I use indicators? I didn't claim that.
Ignored
I believe it would be more constructive to open a thread for yourself and share all the wisdom that you have with others here at FF instead of just criticizing someone else´s thread.
I´m very courious to know which factors are important to you other than PA and S.R levels.
Joined Oct 2008
|
Status: Just be the witness.
|1,089 Posts
rednose
thank you for taking the time, the pdf is very useful.
=====
All I can say is that the knowledge of WMD, or BRV from No Brainer is invaluable for thinking on my own and trying to really understand what is going on. Of course there might be some Volume Analysis or Market Auction profile people scoffing at these " simple " tools, but at least for me its great.
And on top of that it`s free and FF provides it. So I`m just grateful.