tfflyer;
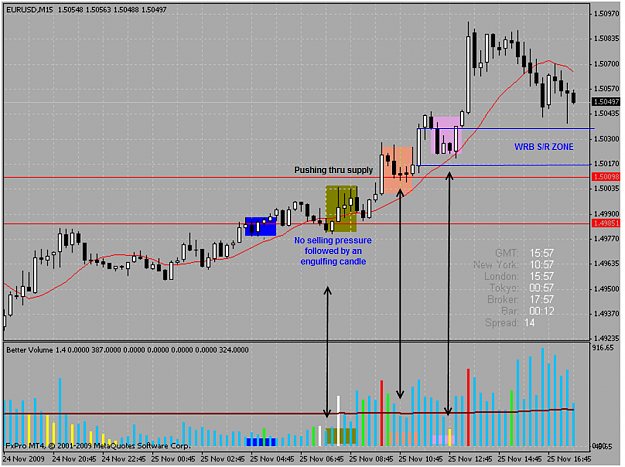
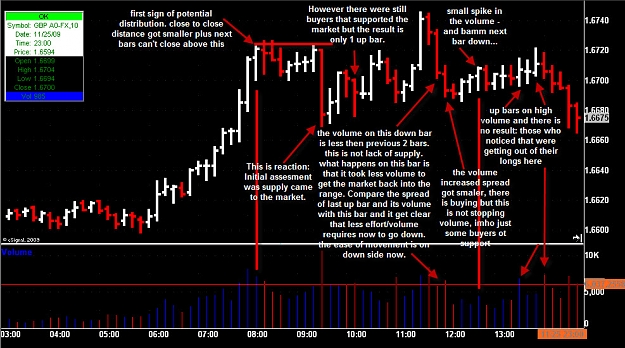
All three show the mark up on increasing volume with the next candle down.
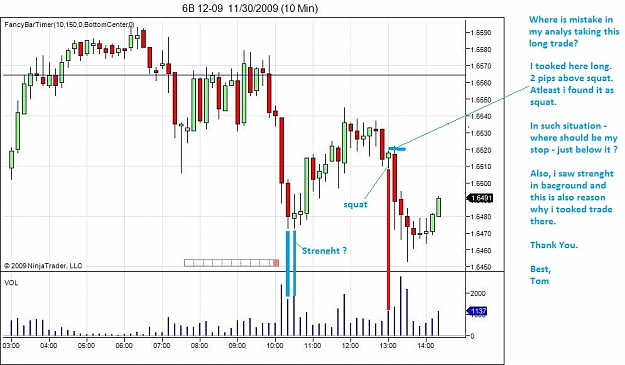
On the IBFX & Duka feed, the next candle has increasing volume on a narrower spread. This is a squat and a sign of weakness. On the futures, the volume decreases on this next candle, but the fact that it is down does show that some supply entered on the prior (Mark Up) candle.
Now things get really interesting.
On IBFX three (3) candles later there is a narrow range down candle on increasing volume. This is a Squat. This candle is making a lower low and not a higher high as it closes down. Thus this is a bullish candle.
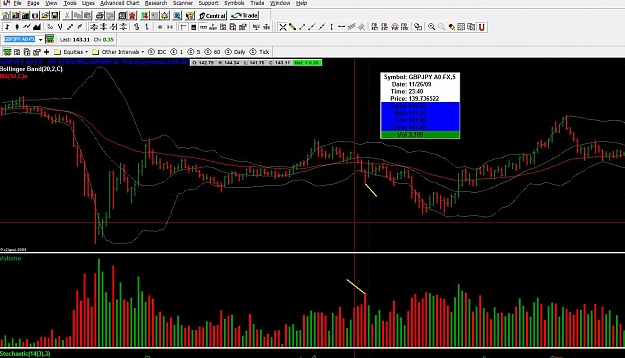
On Duka it is a bit harder to see (the chart), but it looks like the same situation here.
On the futures, things are different. The narrow range squat comes after two (2) candles. That is to say, it comes a candle earlier than on the other two feeds. The next candle, which would be the third, is a NO Supply as it has volume less than the previous two candles on a narrow (NR4) range down candle. So while the other two are showing support coming in (buying), futures is showing a lack of selling (supply).
If two different traders were to look at one chart, like the IBFX, they could come to different conclusions. If the same trader was looking at two different charts, like the IBFX and futures, the trader would come to the same conclusion. With the futures the path is slightly different but the destination is the same.
In the end all anyone can do is trade what they see.
All three show the mark up on increasing volume with the next candle down.
On the IBFX & Duka feed, the next candle has increasing volume on a narrower spread. This is a squat and a sign of weakness. On the futures, the volume decreases on this next candle, but the fact that it is down does show that some supply entered on the prior (Mark Up) candle.
Now things get really interesting.
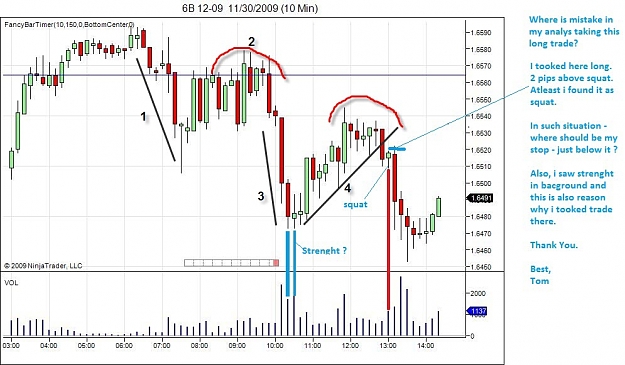
On IBFX three (3) candles later there is a narrow range down candle on increasing volume. This is a Squat. This candle is making a lower low and not a higher high as it closes down. Thus this is a bullish candle.
On Duka it is a bit harder to see (the chart), but it looks like the same situation here.
On the futures, things are different. The narrow range squat comes after two (2) candles. That is to say, it comes a candle earlier than on the other two feeds. The next candle, which would be the third, is a NO Supply as it has volume less than the previous two candles on a narrow (NR4) range down candle. So while the other two are showing support coming in (buying), futures is showing a lack of selling (supply).
If two different traders were to look at one chart, like the IBFX, they could come to different conclusions. If the same trader was looking at two different charts, like the IBFX and futures, the trader would come to the same conclusion. With the futures the path is slightly different but the destination is the same.
In the end all anyone can do is trade what they see.
Wyckoff VSA: (1) Supply & Demand (2) Effort vs. Result (3) Cause & Effect