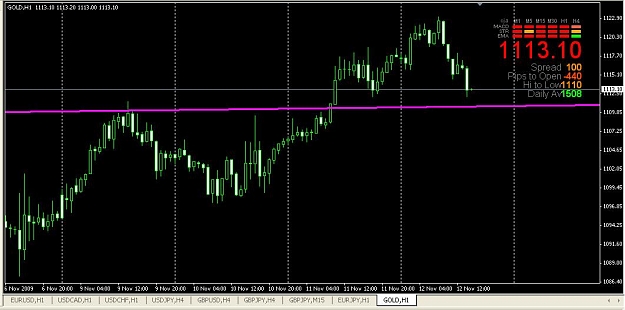
Here's a interesting formation developing as the solid color ema's
gather between 1.6614 and 1.6635. If the price will range between
here (~1.6530) and the aqua 144 ema at ~1.6614 it will draw these
into a tighter compression. Being on a 1hr chart this could produce
a large movement if it fully forms and when they separate... often
with force and energy and sharp directional movement. Watch and see.
Last major breakouts as seen on the 2nd 1hr chart were 10/29 5GMT
and 11/04 5GMT each resulting in 200+ and 400+ pips respectively.
Dr. D.
Attached Images