Right one more attempt to explain.
Sorry I have made this hard to understand... once you see what I mean the penny will drop.
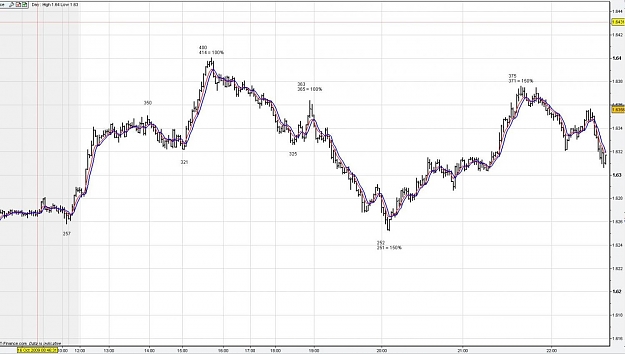
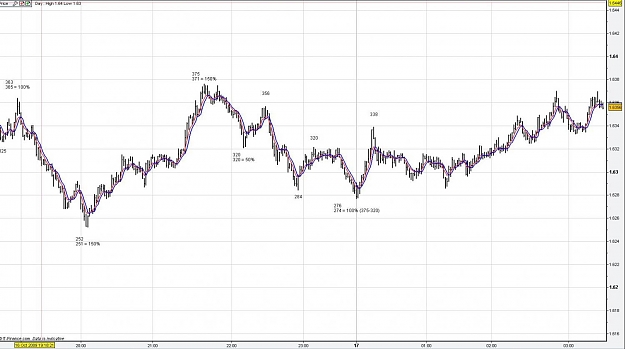
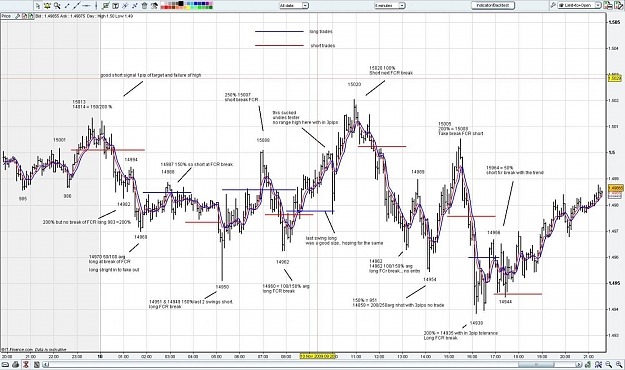
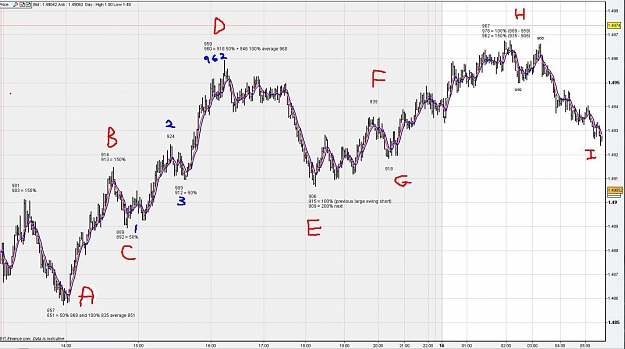
This example is from the chart on post 4.
As always I am not top and bottom picking but if a high forms and it looks like I may get a signal short I will do my ranges quickly to see if the high looks finished or there is a target point 15pips higher.
OK let start.
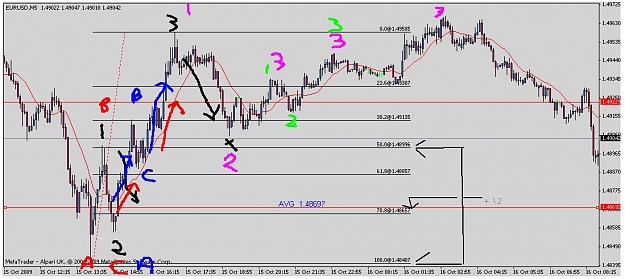
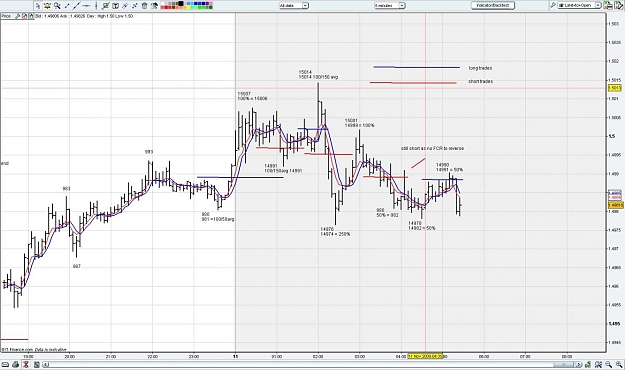
Have a look at the drawing of the chart.
a) First I will take the range from A-B (914 - 857) = 57 pips
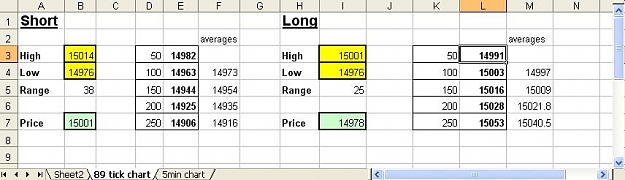
I will then use the excel spread sheet attched to work out targets but here it will all be manual.
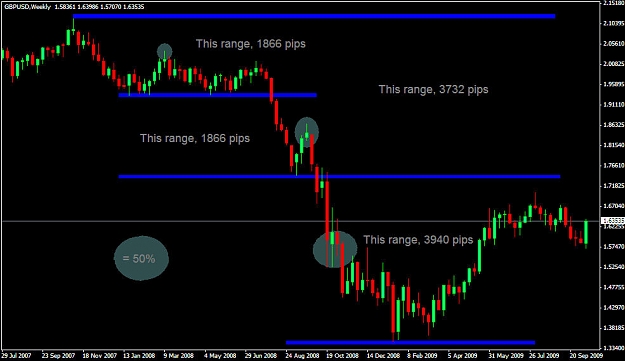
b) Take the range 57 which = 100% of the last swing long. Divide in 2 = 28.5 = 50% etc you should be able to work out the other ranges.
We now have the percentages of the laast run long (A-B)
50% = 28.5
100% = 57
150% = 85
200% = 114
c) Now we want to calculate possible targets long from the NEW low point C.
So we take point C (889) and add the calculated percentages of the last swinglong.
889 + 28.5 (50%) = 918 this is 50% of the last swing long.
889 + 57 (100%) = 946 this is 100% of the last swing long.
889 + 85 (150%) = 975 this is 150% of the last swing long.
889 + 114 (200%) = 1003 this is 200% of the last swing long.
Attched is a picture of my excel spreed sheet.
Point D = 959
So price does not fit the 50%, 100% and is under 150%
When this happens I look for an average... usually 50 +100 but in this case its 100+150 (946 + 975)/2 = 960
Yes I have made an error on this chart.. won't be the last.
But also you would have calculated the swing long from the 123 and the 150% = 962.
So using 2 swing long you have a nice price group at this number so you feel good that this might be a high and are happy to take the next short signal.
Looking at point E now.
I alwsys start with the largest most recient range and work backwards.
The largest range short is at the start of the chart befor B
901-857 swing short.
50% = 937
100% = 915
low is 906.
If we want confimation from another swing we will use B-C swing short 25 pips and do the same thing.
50% 947
100% 934
150% 922
200% 909
low is 906
So we have 915 and 906 100% and 200% of the last 2 swings short.
Low 906
We are now looking for F
Take the last swing long 3 - D (959 - 909) and add the range to point E
50% = 931
High is 935
We are looking for point H from the 906 low.
last swings long
(1-D) 889-959 = 100% 976
(E-F) 906-935 = 200% 964
(3-D) 959-909 = average 100% + 150% = 968
High 967
Just for interest average the three prices... 976+964+968 /3 = 969
OK this looks like a good high I feel confodent to take the next short signal based on PA.
Hope that make its clear as mud.
Regards
Duke.
Sorry I have made this hard to understand... once you see what I mean the penny will drop.
This example is from the chart on post 4.
As always I am not top and bottom picking but if a high forms and it looks like I may get a signal short I will do my ranges quickly to see if the high looks finished or there is a target point 15pips higher.
OK let start.
Have a look at the drawing of the chart.
a) First I will take the range from A-B (914 - 857) = 57 pips
I will then use the excel spread sheet attched to work out targets but here it will all be manual.
b) Take the range 57 which = 100% of the last swing long. Divide in 2 = 28.5 = 50% etc you should be able to work out the other ranges.
We now have the percentages of the laast run long (A-B)
50% = 28.5
100% = 57
150% = 85
200% = 114
c) Now we want to calculate possible targets long from the NEW low point C.
So we take point C (889) and add the calculated percentages of the last swinglong.
889 + 28.5 (50%) = 918 this is 50% of the last swing long.
889 + 57 (100%) = 946 this is 100% of the last swing long.
889 + 85 (150%) = 975 this is 150% of the last swing long.
889 + 114 (200%) = 1003 this is 200% of the last swing long.
Attched is a picture of my excel spreed sheet.
Point D = 959
So price does not fit the 50%, 100% and is under 150%
When this happens I look for an average... usually 50 +100 but in this case its 100+150 (946 + 975)/2 = 960
Yes I have made an error on this chart.. won't be the last.
But also you would have calculated the swing long from the 123 and the 150% = 962.
So using 2 swing long you have a nice price group at this number so you feel good that this might be a high and are happy to take the next short signal.
Looking at point E now.
I alwsys start with the largest most recient range and work backwards.
The largest range short is at the start of the chart befor B
901-857 swing short.
50% = 937
100% = 915
low is 906.
If we want confimation from another swing we will use B-C swing short 25 pips and do the same thing.
50% 947
100% 934
150% 922
200% 909
low is 906
So we have 915 and 906 100% and 200% of the last 2 swings short.
Low 906
We are now looking for F
Take the last swing long 3 - D (959 - 909) and add the range to point E
50% = 931
High is 935
We are looking for point H from the 906 low.
last swings long
(1-D) 889-959 = 100% 976
(E-F) 906-935 = 200% 964
(3-D) 959-909 = average 100% + 150% = 968
High 967
Just for interest average the three prices... 976+964+968 /3 = 969
OK this looks like a good high I feel confodent to take the next short signal based on PA.
Hope that make its clear as mud.
Regards
Duke.
Attached Image (click to enlarge)
Attached Image