Here is what I see. It is significant because I was bearish as all get out with a medium term projection down to mid 1.44. Usually you only see things that support your own bias so I took particular notice of this analysis
Weekly Chart
last sessions drop targeted the weekly trendline and bounced forming a doji so far. There just happened to be a fib level intersecting the trendline for good confluence for trading long at that level.
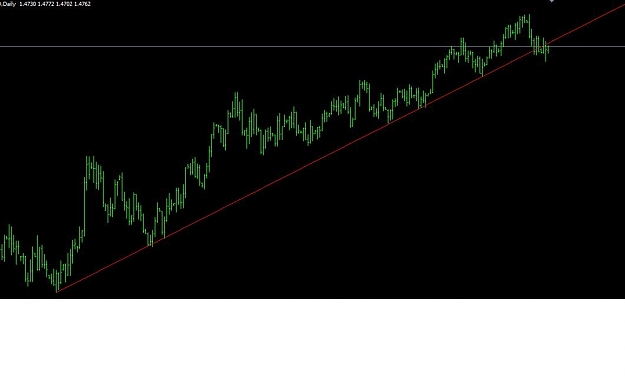
Daily Chart
The daily chart shows a hammer as the move down retraced 61% with oscilator divergence.
I have a bullish bias based on these technicals and anticipate a move higher, possible ignited by upside surprise payroll numbers this friday
Weekly Chart
last sessions drop targeted the weekly trendline and bounced forming a doji so far. There just happened to be a fib level intersecting the trendline for good confluence for trading long at that level.
Daily Chart
The daily chart shows a hammer as the move down retraced 61% with oscilator divergence.
I have a bullish bias based on these technicals and anticipate a move higher, possible ignited by upside surprise payroll numbers this friday
Attached Image(s) (click to enlarge)
BTC Return This Year:
7.6%