No, my rules for hard breaks do not change be it PBs, Outside Bars, DBHLC, etc. Yes I will change the size of the stop loss depending on the pair like the Gbp/Jpy.
The heart of this style as with any style of trade management (as I known you know well Aaron) is assessing the quality of the PA setup. Once that is assessed as high quality, then James16's "This is Critical" aka the traffic of the setup is observed.
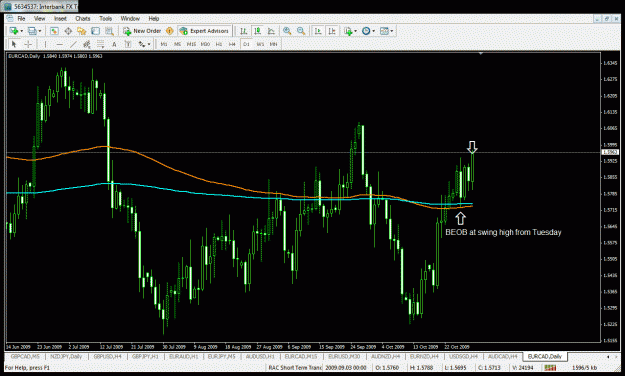
Let's take the current Daily Gbp/Jpy. We have a BEOB at a swing High and a BUOB at a...
I went back to page 1 again as I felt as though my trading is in a confused state of late.
I have just realised something..
I will have my charts blank and draw ppz fibs watever at an obvious level and i will wait for price to get there and THEN SEE what happens.
I think of late of have been trying to make trades happen from nothing obvious.
Ignored
It happens.
For me it happened so often that it became close to being hilarious.
The best thing to do is what you've done...revert back to the hardcore basics,
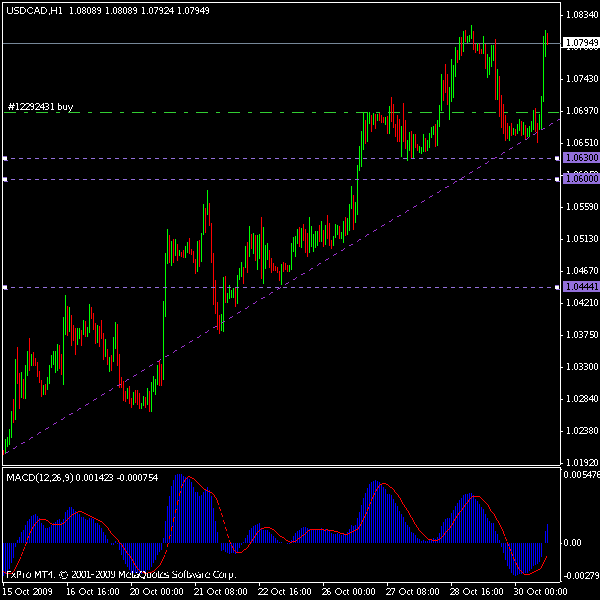
I was looking at the 1.0700 level as a KaBoom level, because it fit the setup. And it did provide some good pips if managed tightly. 1.0700 lined up with the recent 61.8 fib level and a support level (Weekly PPZ) that could have acted as resistence. (1st chart)
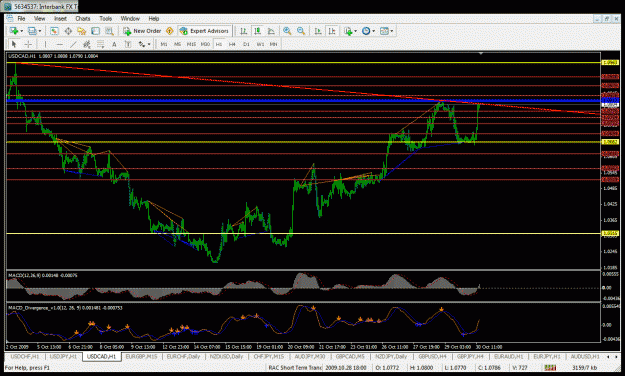
The Rac Kaboom level (the real KaBoom) had the 61.8 fib level high at the top of the recent consolidation area, 1.0800 PPZ level which had an added highlighted area that Rac pointed out (check mark, 2nd chart).
Both trades were with the current trend.
Ignored
jarroo..
when i saw this chart i looked at it the way u did the first time ..(confluence with 1.07)-it didnt look really nice to me because of how much it had went thru resistance...
but on the second one, (where 1.08 is the confluence area), looked much better.
my question is, how do u know which way to plot that fib? and what do u mean by 'hard break'?
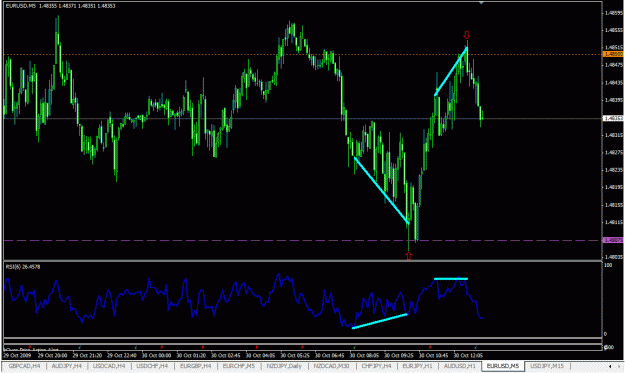
Just one question, how did you manage the long? stop below PB or fast TP?
Ignored
Thanks!
Yea stop below the nose. It was very stressing to see that retrace and I was sure I made the same mistake again like yesterday. I have caught only half of that move. I had a setted TP order 1.4832 at that PPZ.
The second one was WAY much easier for me to enter....I am playing only with profits and I have the round number supporting me.
Edit: the second one is shooting down!!! Still in!
I have known Dr. Ron Paul for all of my life. He was my mothers OB/GYN from 1968 until 1973. He delivered my two younger brothers. This is a man of integrity and balance. I have supported him for many years. I hope that more people will look at his message and decide for themselves. Some of what he says is tough to hear but I believe that he speaks the truth about our nations current status.
when i saw this chart i looked at it the way u did the first time ..(confluence with 1.07)-it didnt look really nice to me because of how much it had went thru resistance...
but on the second one, (where 1.08 is the confluence area), looked much better.
my question is, how do u know which way to plot that fib? and what do u mean by 'hard break'?
thanks in advance!
Ignored
Hey art. Actually, because Price broke hard through the support level of the 1.07, it is more likely to become a resistence level in my experience. And form a nice PPZ level, as with the Weekly.
The 1.0800 looked more in traffic to me. But the area bar Lows that Rac pointed out (check mark on my recent chart) proved to play an important role.
Fib level from recent major swing High/Low on the given time frame.
All quality Price Action setups have an inherent momentum movement in them, imo. So when then do break and break hard and fast, robustly, in confirms to me that the setup is correct.
Indicators show the past. Price Action "Indicates" the future.
|
Joined Jul 2009
|
Status: THANK YOU JAMES AND MIKE!!!
|936 Posts
Is there any programming section or something like that in FF where I can open a thread about the EA I want to buy from any programmer that will make it for me?
Hey art. Actually, because Price broke hard through the support level of the 1.07, it is more likely to become a resistence level in my experience. And form a nice PPZ level, as with the Weekly.
The 1.0800 looked more in traffic to me. But the area bar Lows that Rac pointed out (check mark on my recent chart) proved to play an important role.
Fib level from recent major swing High/Low on the given time frame.
All quality Price Action setups have an inherent momentum movement in them, imo. So when then do break and break hard and fast,...
is it on break of the PA or on break and then retrace, at some retrace level?
Ignored
Just below/above a given setup, I will use a buffer of 10 to 15 pips. If it retraces after the break it may stop me out at break even. If it stops me out at break even and retraces further, I will look to enter again provided a quailty set up is given.
Joined Jan 2008
|
Status: In Fibonacci We Trust
|2,397 Posts
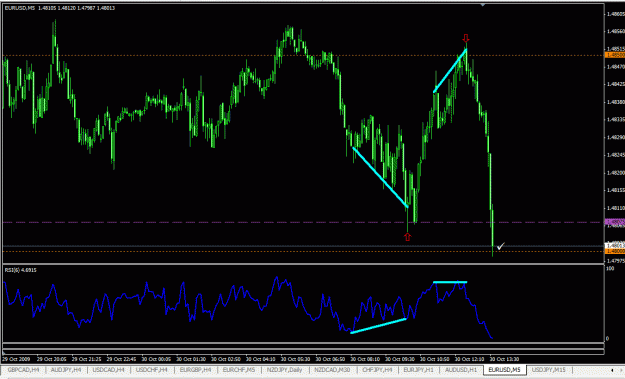
New Traders- That Daily BEOB from Tuesday just bit the dust. Did anyone anticipate this trade short and get in before the break? We wait for the break of the bar to trade this BEOB at swing high. If we do not wait for that break, we are more likely to lose our money.
I sure you noticed that the 1.4850 level is a Daily PPZ level. Right Ben?
Higher time frames RULE even on the 5min chart. I don't know how one trades these lower time frames without first mapping out the PPZ levels, PA if any, confluenced areas, etc., on the higher time frames.
Nice trade Ben.
Indicators show the past. Price Action "Indicates" the future.