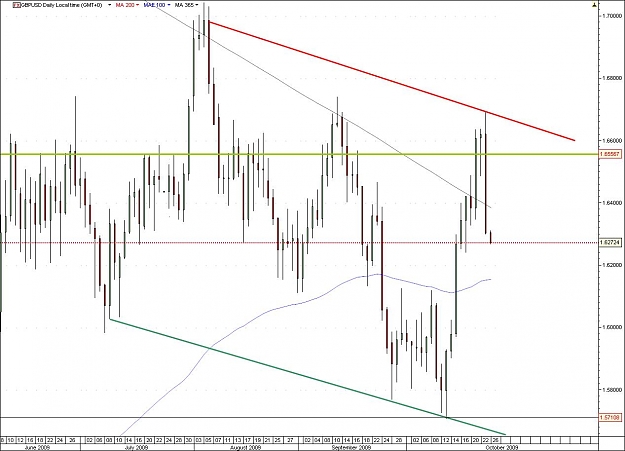
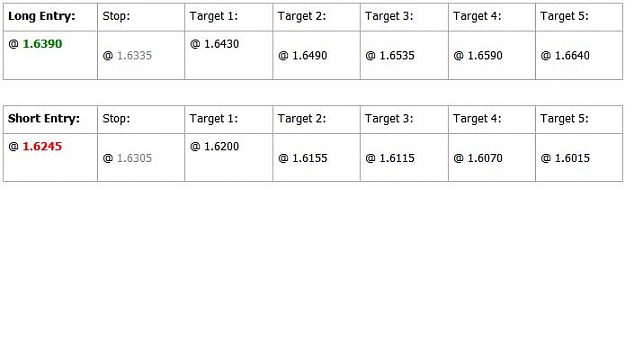
Are we really going to free fall back to 1.57 area? Looking for 1.611x area as really strong support.
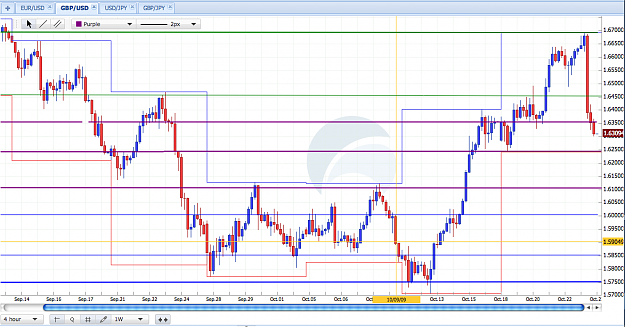
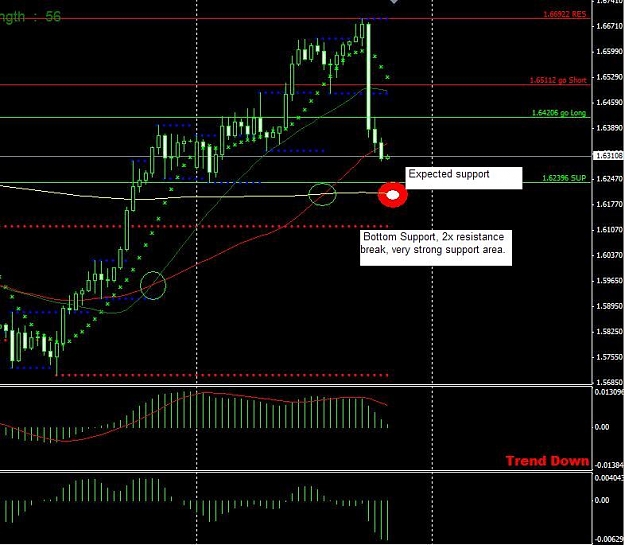
Using the same indicators I use on my H4 - m1 play ranges, I have taken and applied them to the longer term charts, going forward from H4 to Weekly.
Using the 200Ma as support on the H4 chart, I believe we can use this as the next area of support. A breach of support at this area puts us falling down to the 1.611x area as it shows great support on the H4, and daily.
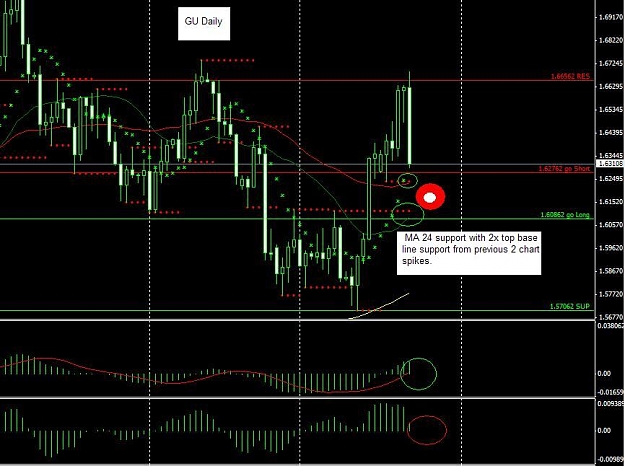
With blood in the street as of current, the logic of traders is to hop onto the short side, and well, I will be sitting there with you but cautiously watching for the targeted fall ranges to the very base support range marked clearly on daily chart. A place where we seen a triple top break out, now becomes a support range when we factor in the MACD, OSMA and the 24MA.
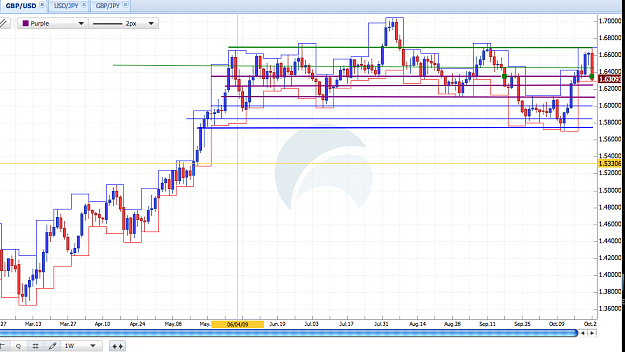
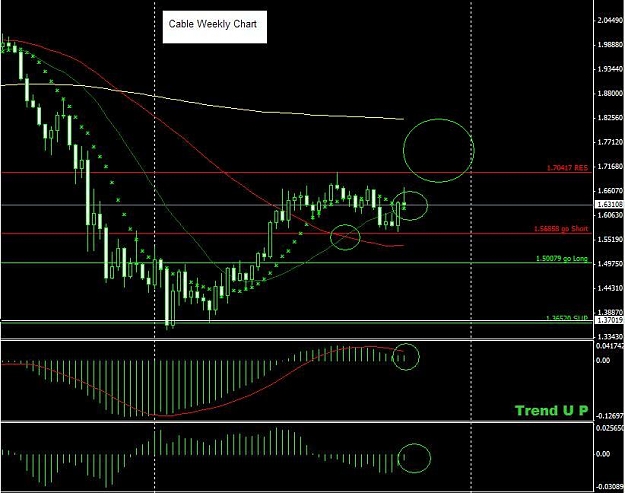
My long term logic is on the weekly chart. Showing us as being in a possible consolidation area before moving on up. With the MACD still above zero and the shrinking negativity of the OSMA, I would fully expect that as the OSMA crosses into positive territory we will see us moving threw the 1.70 area and seeing the top yellow 200MA as becoming our topside resistance,(weekly chart).
Using the same indicators I use on my H4 - m1 play ranges, I have taken and applied them to the longer term charts, going forward from H4 to Weekly.
Using the 200Ma as support on the H4 chart, I believe we can use this as the next area of support. A breach of support at this area puts us falling down to the 1.611x area as it shows great support on the H4, and daily.
With blood in the street as of current, the logic of traders is to hop onto the short side, and well, I will be sitting there with you but cautiously watching for the targeted fall ranges to the very base support range marked clearly on daily chart. A place where we seen a triple top break out, now becomes a support range when we factor in the MACD, OSMA and the 24MA.
My long term logic is on the weekly chart. Showing us as being in a possible consolidation area before moving on up. With the MACD still above zero and the shrinking negativity of the OSMA, I would fully expect that as the OSMA crosses into positive territory we will see us moving threw the 1.70 area and seeing the top yellow 200MA as becoming our topside resistance,(weekly chart).
Attached Image(s) (click to enlarge)
Money Can't Buy Happiness. Poverty Can't Buy SHIT! You Choose!