I like this "8hr pin" and bullish divergence. Long at the break and partial profit at 150.00.
Ignored
Please clarify bro...
u mean 8hr PB on higher swing low?
& break of 8hr PB, red TL &/or aqua blue MA?
bullish div. or is it hidden bearish divergence (plotted red divergence on the chart)? (or probably u are referring to a bullish div on a lower TF chart?)
i think i have rarely traded this pair. so i may be of with my comments...
anyway, looking at that chart, i think this DBHLC is tradeable, but immediate traffic area see to be 0.7400 area.
alternatively, a breakout trade above 0.75 (is this the top price?) is possible too --a two bar/two matching highs trade.
are u on demo/live? regardless, if u are unsure of what to do, better let it pass.
Ignored
Hi SC, thanks. Yes I am still on demo. Still struggling in applying this PA stuffs. Everytime I thought I got it right, the market just smack me down. Sigh.. Well guess just need to keep learning.
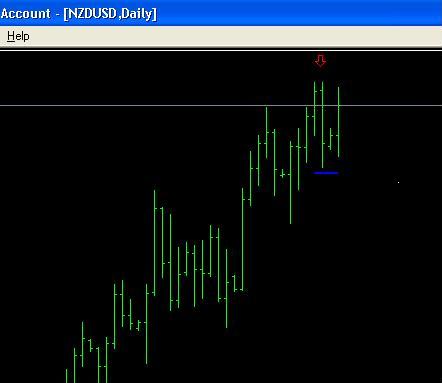
Back to topic. If you don't mind, another question about DBHLC, DBLHC, BUOVB and BEOVB. Do we need to wait for the break of the last bar to consider it as a valid setup? (the blue line on the chart)
Hi SC, thanks. Yes I am still on demo. Still struggling in applying this PA stuffs. Everytime I thought I got it right, the market just smack me down. Sigh.. Well guess just need to keep learning.
Back to topic. If you don't mind, another question about DBHLC, DBLHC, BUOVB and BEOVB. Do we need to wait for the break of the last bar to consider it as a valid setup? (the blue line on the chart)
Ignored
yeah thats right as with all these trigger bars we need them to break before they can be considered valid. with experience you may be able to pre-empt the signals but it is not necessary to make a living.
i wont comment on the dbhlc or the dblhc as i dont trade them as yet
jon
.. Well guess just need to keep learning.
...another question about DBHLC, DBLHC, BUOVB and BEOVB. Do we need to wait for the break of the last bar to consider it as a valid setup? (the blue line on the chart)
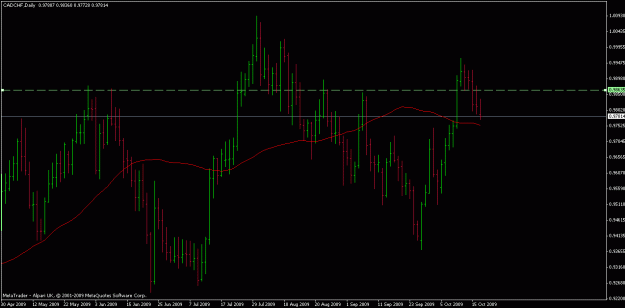
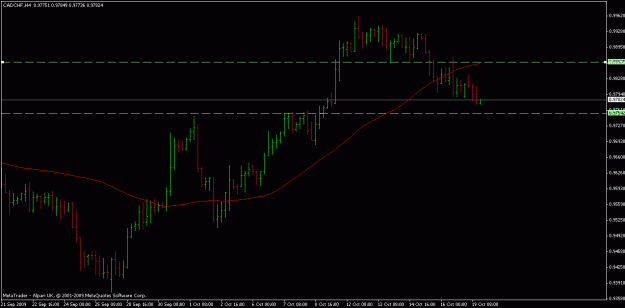
I could use a little help if you guys can... I am holding a short position on the CAD/CHF from 9868 and have held onto it for a few days now (way longer than I normally do!) I am working on a less itchy trigger finger and not moving stops all the time!
What sort of exit strategy would you guys work on? I have drawn a target on the chart of 9753. I am thinking about the 2bar stop or trailing the fib or moving stop to swing highs but I can't decide which way to go.... or which timeframe to focus on
thanks
Thanks guys for clarifying. You guys and many seniors here are really being helpful. Hope that one day I could reach your level and share the knowledge here too....
|
Joined Jun 2007
|
Status: Truth is an empty cup
|459 Posts
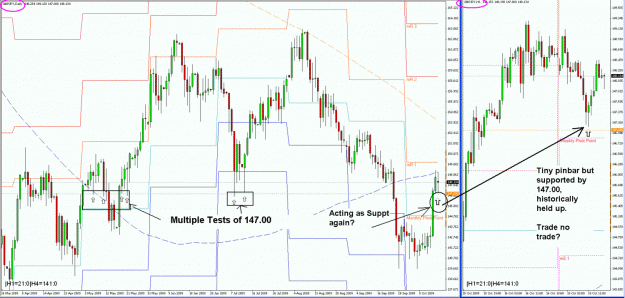
Heya Guys,
Got a quick question / Interesting point to share.
(ok, if someone else has done this, sorry. 3000+ pages on the thread. I confess I aint read through everything yet. )
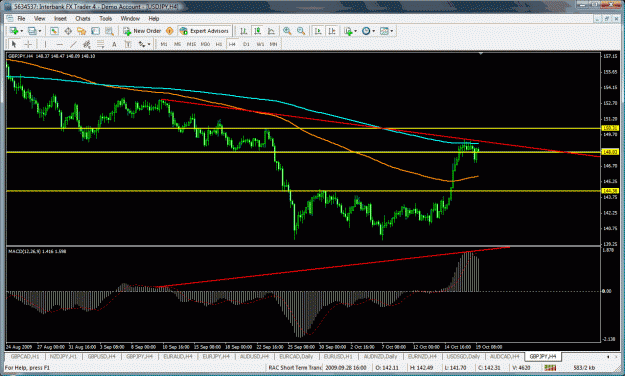
There was a PB in Geppy 1 hour.
On the 1hour itself its definitely too damn tiny to take, although it was off 147.00 (kinda, 147.11) and also in an uptrend.
BUT, as I was looking back in 20/20 and checked out the Daily, there was HEAP of old lows at 147.00.
My thoughts are actually that since 147.00 has been such a significant historic PPZ / round number level, even though the pinbar was pretty tiny, it was still tradeable in the 1hour.
In other words, using daily ppz+round number for 1hour trade.
Of course, needless to say, the trade would have to be managed as it moved into the 148.00 region where there is a mess of stuff in the 1hour.
Hi SC, thanks. Yes I am still on demo. Still struggling in applying this PA stuffs. Everytime I thought I got it right, the market just smack me down. Sigh.. Well guess just need to keep learning.
Back to topic. If you don't mind, another question about DBHLC, DBLHC, BUOVB and BEOVB. Do we need to wait for the break of the last bar to consider it as a valid setup? (the blue line on the chart)
Ignored
Like property, location is everything with these bars. We want to trade these in areas that have had clear past support or resistance, or at swing low/high. If you combine the setup with some divergence, fib levels, and common ema's your trade quality will increase. A break of the bar would be your entry. Take care and keep on practicing. Dion
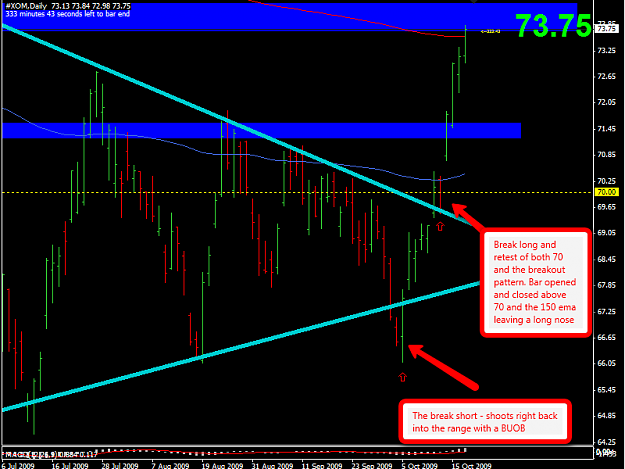
Is anyone watching this? It looks like a pretty clear breakout pattern. Location looks good, ppz at round number 70.00, 150ema and a bunch of fibs also line up with 70.00 to the long side. The weekly trend is up.
Here are the 2 scenarios which I'm looking at. I'm liking the heavy confluence at 70 and I'd like to see a breakout to the upside and a pullback to 70.
What do you guys think?
Ignored
Here is a chart I have been watching for a long time now and it finally seems to have played out. This is exxon mobil (XOM) daily. A very clear consolidation pattern. I was looking for a breakout long and a pullback to the highly confluenced 70.00 level.
Since my last post it looks like price broke short but reversed back into the range with a large BUOB. After getting to the top of the range, price broke long and pulled back to the 70 level. It formed a pinnish looking inside bar on the daily off 70 and this confirmed the breakout long for me. (Note - This bar is not a pin and not at a swing low where we want them--don't get confused and think this bar is good enough to trade by itself because it isn't)
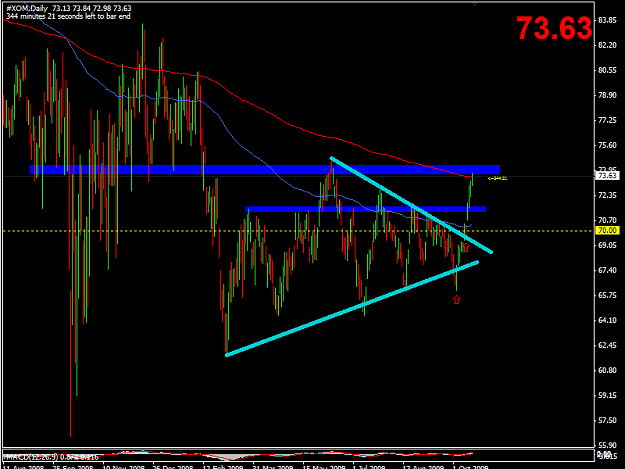
Now it looks like price has hit a major area (ppz and 365 ema). This setup took over a month to play out but I think it was well worth the wait and you certainly had plenty of time to develop a plan to trade it.
I hope this helps someone see that patience pays off, and also to stick with the obvious. I'm sure most people watching this chart had these clear lines drawn and were watching for a break. Momentum kept building until a breakout occurred. The high momentum setups are the easiest and most stress free to manage.
I think I felt more stress waiting for something to happen than actually trading what I had been waiting for all this time.
I could use a little help if you guys can... I am holding a short position on the CAD/CHF from 9868 and have held onto it for a few days now (way longer than I normally do!) I am working on a less itchy trigger finger and not moving stops all the time!
What sort of exit strategy would you guys work on? I have drawn a target on the chart of 9753. I am thinking about the 2bar stop or trailing the fib or moving stop to swing highs but I can't decide which way to go.... or which timeframe to focus on
thanks
Ignored
I would focus and stay on the same time frame that you pulled the trigger. As far as TP method, you will need to figure that out on your own. Some take partial/full profit at obvious problem areas and then let the rest run with a trail stop or next problem area as tp. Try looking back at past setups and what they did. You may discover some gold. Be observant of trend and ppz per trade setup. Was the trade a counter or continuation trend? Was it off of a significant ppz area, or just a minor correction, etc.?
Anyone who plays breakouts or anything similar to what I posted above I'd like to hear any comments (good or bad lol). Also, if anyone has any questions about that setup let me know.
I see one other poster took a loss on the Daily AJ Pin Bar. I took a loss as well.
The location was iffy, space was GREAT, bar was GREAT, there was MACD divergence.
Pin broke by about 18 pips and then turned back.
I woke up at my 5 am and saw I was about to get stopped out. I then remembered Mike's words about Fridays being profit taking days.
Must have just been a profit taking pin.
Do the seniors here disregard set-ups like this on Sunday evenings? A strong trend with a good bar in the opposite direction forming on Friday? Did any of the seniors play the AJ?
Anyone who plays breakouts or anything similar to what I posted above I'd like to hear any comments...
Ignored
nice trade, Scott. patience pays, huh.
Quote
Disliked
It formed a pinnish looking inside bar on the daily off 70 and this confirmed the breakout long for me. (Note - This bar is not a pin and not at a swing low where we want them--don't get confused and think this bar is good enough to trade by itself because it isn't)
did this pinnish IB closed near the open? nice brkout & pullback.
the false brkout to the downside stopped at a previous (hgiher swing) low @ 66.00. t0 me, 66.00 would be the low of the 'smaller' range while 64.30-ish is the low of the 'bigger' range. (the top of 'both' range/s would be 74.00, imo)
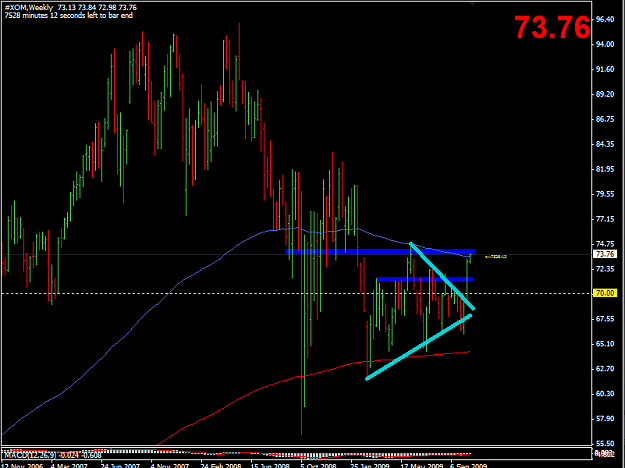
Looking at the weekly, 74.00 seems to be the lower part of another range. noticed too how 'smooth sailing' price went from 72 ('top of the range') to 74 (bottom of the upper range')
Got a quick question / Interesting point to share.
(ok, if someone else has done this, sorry. 3000+ pages on the thread. I confess I aint read through everything yet. )
There was a PB in Geppy 1 hour.
On the 1hour itself its definitely too damn tiny to take, although it was off 147.00 (kinda, 147.11) and also in an uptrend.
BUT, as I was looking back in 20/20 and checked out the Daily, there was...
Ignored
Makes sense cyrus, but for the way I trade, which is with price bars. I hate tiny bars. I just prefer to see a decent sized reaction off whatever are I am looking for. This really gives me the confidence factor in my trades. That bar doesn't even really qualify as a pin in my book also because the nose barely protrudes away from the prior low. If price didn't go higher, would you ever look back at that bar and good, yeah that was a good one? Again I am not saying that in a mocking way of course, if you would, then fair enough. If you wouldn't that might teach you a lot. So either way
An exercise, go back and scroll through your charts and only look at bars that are bigger then the previous bars(the range of bars on your screen). These will be the bars that JUMP out at you. You should easily be seeing patterns that you can build from there, without even the meat of what we do with S/R.
I see one other poster took a loss on the Daily AJ Pin Bar....
Ignored
Hey tJ
I don't ignore fridays, but I ignore small bars. Sort of a followup to the previous post. This bar is what I believe kills people more then helps them. It is a pinbar, but it doesn't really have any staying power to me based on its size. If you take this exact scenario and add not a good bar, a GREAT bar, you now have a winning trade. This is how I see it, and why I really try to emphasize bar size in my posts.
Anyone who plays breakouts or anything similar to what I posted above I'd like to hear any comments (good or bad lol). Also, if anyone has any questions about that setup let me know.
Scott
Ignored
Nice Scott,
Breakout trading is IMO a really nice and pretty easy to learn. Like price bars, if we wait for clear obvious patterns that everyone draws, and then add in the S/R, PPZ, PA bars Jim teaches it is another yet great tool to have
did this pinnish IB closed near the open? nice brkout & pullback.
the false brkout to the downside stopped at a previous (hgiher swing) low @ 66.00. t0 me, 66.00 would be the low of the 'smaller' range while 64.30-ish is the low of the 'bigger' range. (the top of 'both' range/s would be 74.00, imo)
Looking at the weekly, 74.00 seems to be the lower part of another range. noticed too how 'smooth sailing' price went from 72 ('top of the range') to 74 (bottom of the upper range')
Ignored
You can't see the close of the pinnish IB because the 150ema is covering it. It closed pretty much right on the 150ema and a few pips away from where it opened.
I agree with you on having 2 different size ranges. I had 2 sets of lines I was watching but I kept the original bottom line from my original post.