Dislikedhey guys
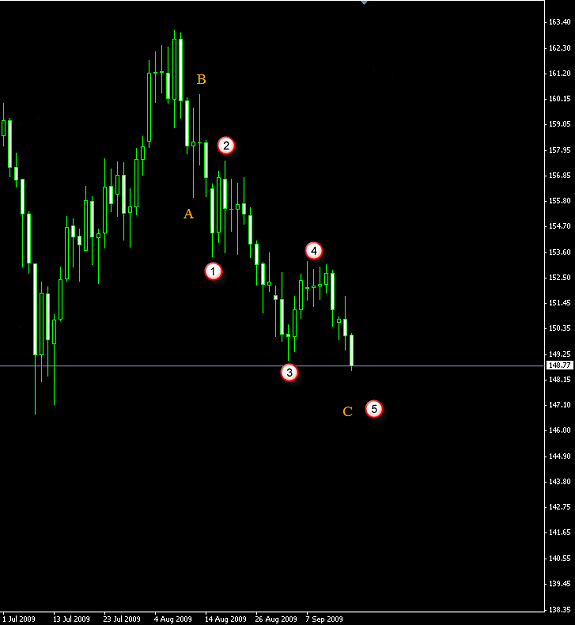
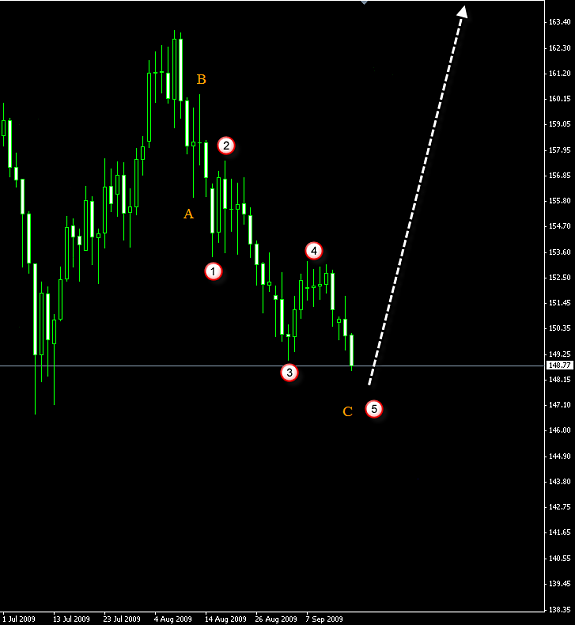
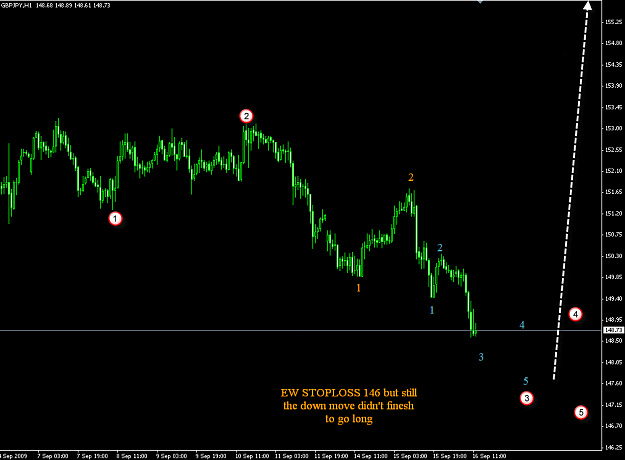
just got stoped out sorry to say that my EW analysis for GJ failed
good call bearsIgnored
- Post #197,901
- Quote
- Sep 16, 2009 5:02am Sep 16, 2009 5:02am
- | Commercial Member | Joined Oct 2008 | 5,712 Posts
- Post #197,902
- Quote
- Sep 16, 2009 5:04am Sep 16, 2009 5:04am
- Joined May 2009 | Status: Member | 4,895 Posts
- Post #197,903
- Quote
- Sep 16, 2009 5:04am Sep 16, 2009 5:04am
- | Commercial Member | Joined Oct 2008 | 5,712 Posts
- Post #197,904
- Quote
- Sep 16, 2009 5:06am Sep 16, 2009 5:06am
- Joined Oct 2007 | Status: Saudi Arabia/Dubai | 3,584 Posts
- Post #197,905
- Quote
- Sep 16, 2009 5:09am Sep 16, 2009 5:09am
- Joined May 2009 | Status: Member | 4,895 Posts
- Post #197,906
- Quote
- Sep 16, 2009 5:13am Sep 16, 2009 5:13am
- Joined Oct 2007 | Status: Saudi Arabia/Dubai | 3,584 Posts
- Post #197,907
- Quote
- Sep 16, 2009 5:13am Sep 16, 2009 5:13am
- Joined May 2009 | Status: Trading, Not Posting | 2,130 Posts
- Post #197,908
- Quote
- Sep 16, 2009 5:13am Sep 16, 2009 5:13am
- Joined Oct 2007 | Status: Saudi Arabia/Dubai | 3,584 Posts
- Post #197,909
- Quote
- Sep 16, 2009 5:15am Sep 16, 2009 5:15am
- Joined May 2009 | Status: Member | 4,895 Posts
- Post #197,910
- Quote
- Sep 16, 2009 5:16am Sep 16, 2009 5:16am
- | Joined May 2009 | Status: Want money, not necessarily skills | 1,113 Posts
"Hate the sin, love the sinner." - Gandhi
- Post #197,912
- Quote
- Sep 16, 2009 5:18am Sep 16, 2009 5:18am
- Joined Apr 2007 | Status: HARD SHYT SCUBA TRADER | 20,883 Posts
Blogging daily now at www.volume.zone
- Post #197,913
- Quote
- Sep 16, 2009 5:24am Sep 16, 2009 5:24am
- Joined Dec 2008 | Status: Member | 2,753 Posts
- Post #197,914
- Quote
- Sep 16, 2009 5:24am Sep 16, 2009 5:24am
- Joined May 2009 | Status: Trading, Not Posting | 2,130 Posts
- Post #197,915
- Quote
- Sep 16, 2009 5:26am Sep 16, 2009 5:26am
- Joined Oct 2007 | Status: Saudi Arabia/Dubai | 3,584 Posts
- Post #197,916
- Quote
- Edited 5:39am Sep 16, 2009 5:29am | Edited 5:39am
- Joined Sep 2006 | Status: Collector | 9,833 Posts
- Post #197,917
- Quote
- Sep 16, 2009 5:34am Sep 16, 2009 5:34am
- Joined Oct 2007 | Status: Saudi Arabia/Dubai | 3,584 Posts
- Post #197,918
- Quote
- Edited 5:59am Sep 16, 2009 5:42am | Edited 5:59am
- Joined Aug 2008 | Status: Money never sleeps | 5,878 Posts
Markets are not Random, they are designed!

- Post #197,920
- Quote
- Sep 16, 2009 5:47am Sep 16, 2009 5:47am
- Joined Oct 2007 | Status: Saudi Arabia/Dubai | 3,584 Posts